Category Archives: Strava

Three things I did last Friday

I took the day off last Friday. It was the first warm day of spring. The weather in the morning was absolutely perfect: still, bright warm sun, without being too hot as the Tasmanian sun often is, and crisp, clear, clean air to breathe.

A Walk to Sphinx Rock

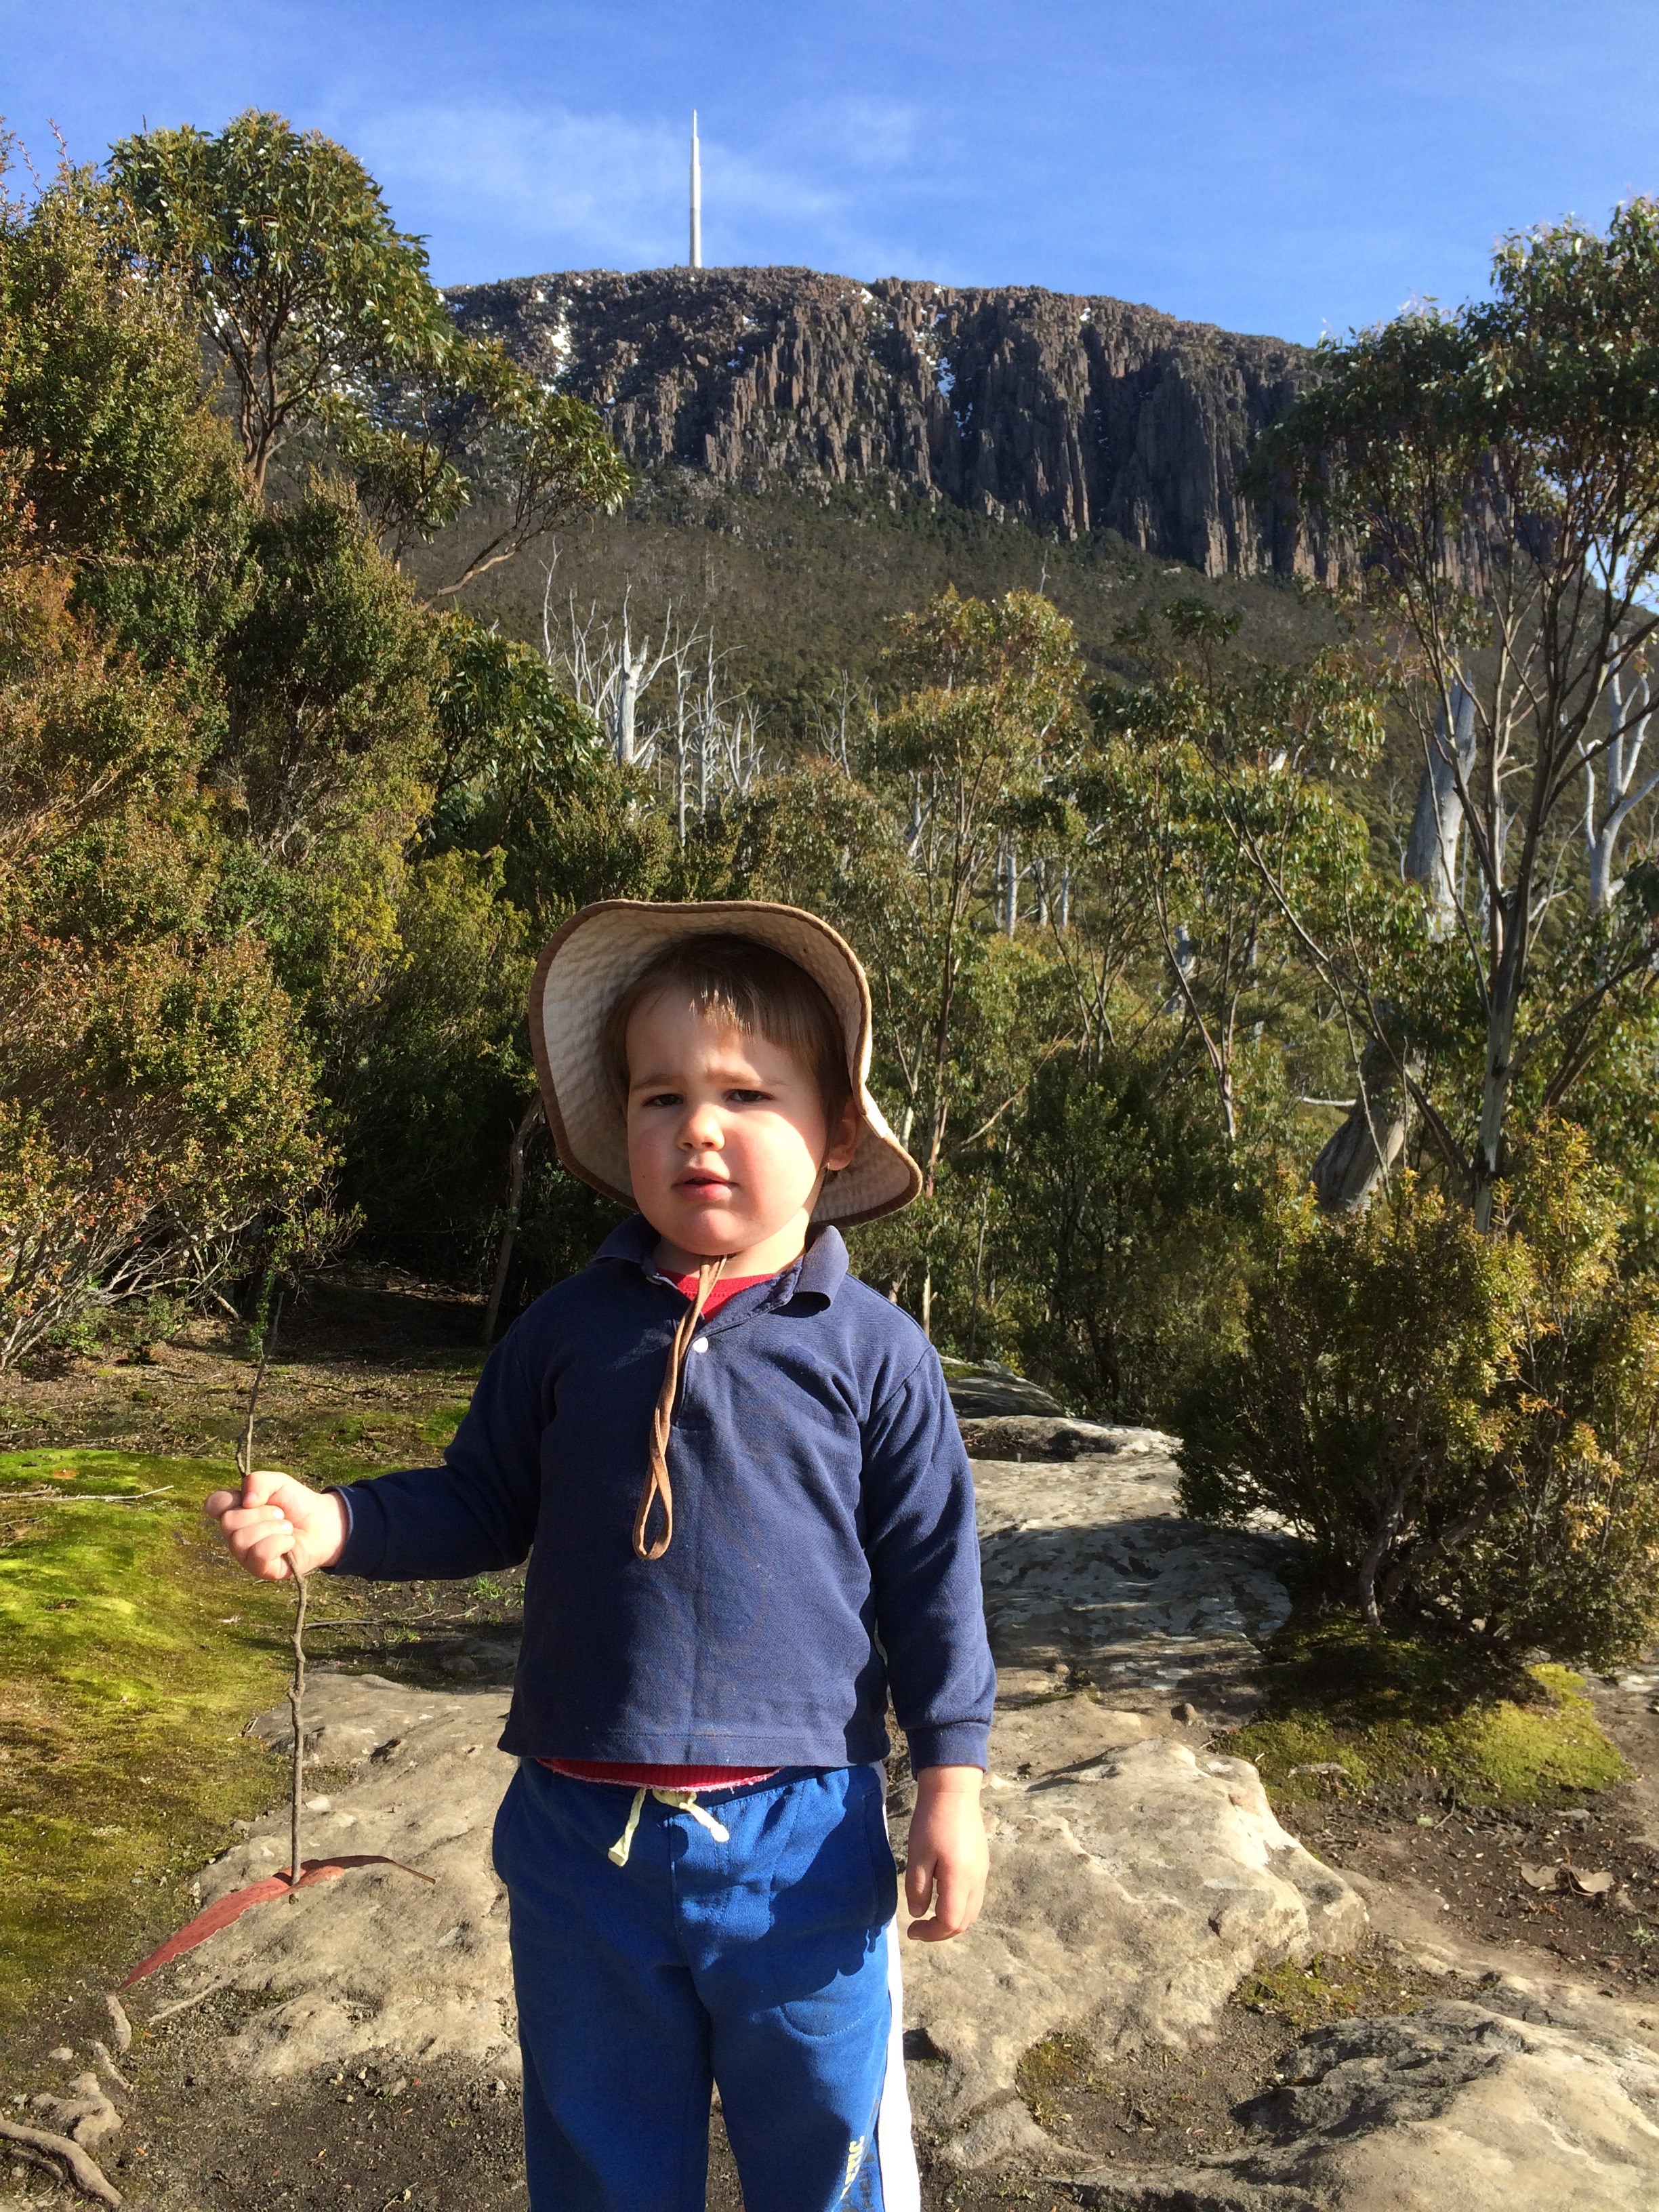
I spent most of the day with my little boy Peter, and we explored the mountain. After his sisters left to go to school, and mum to go to work, he and I grabbed some snacks and drove to The Springs. We were going to walk to Sphinx Rock, have some morning tea there, and then maybe walk a bit further. The day was glorious and we didn’t feel the need to be too specific.

Bushwalking at a two-year-old’s pace can be frustrating. After a minute, Peter found a great stick, and so we had to stop at each rock and each tree to give these trees and rocks a poke. Patience is good for the soul. Peter had many questions about the drains on the side of the path, and the leaves, and the forest. The track from The Springs to Sphinx Rock (Lenah Valley Track) is well formed and very accessible to little legs.

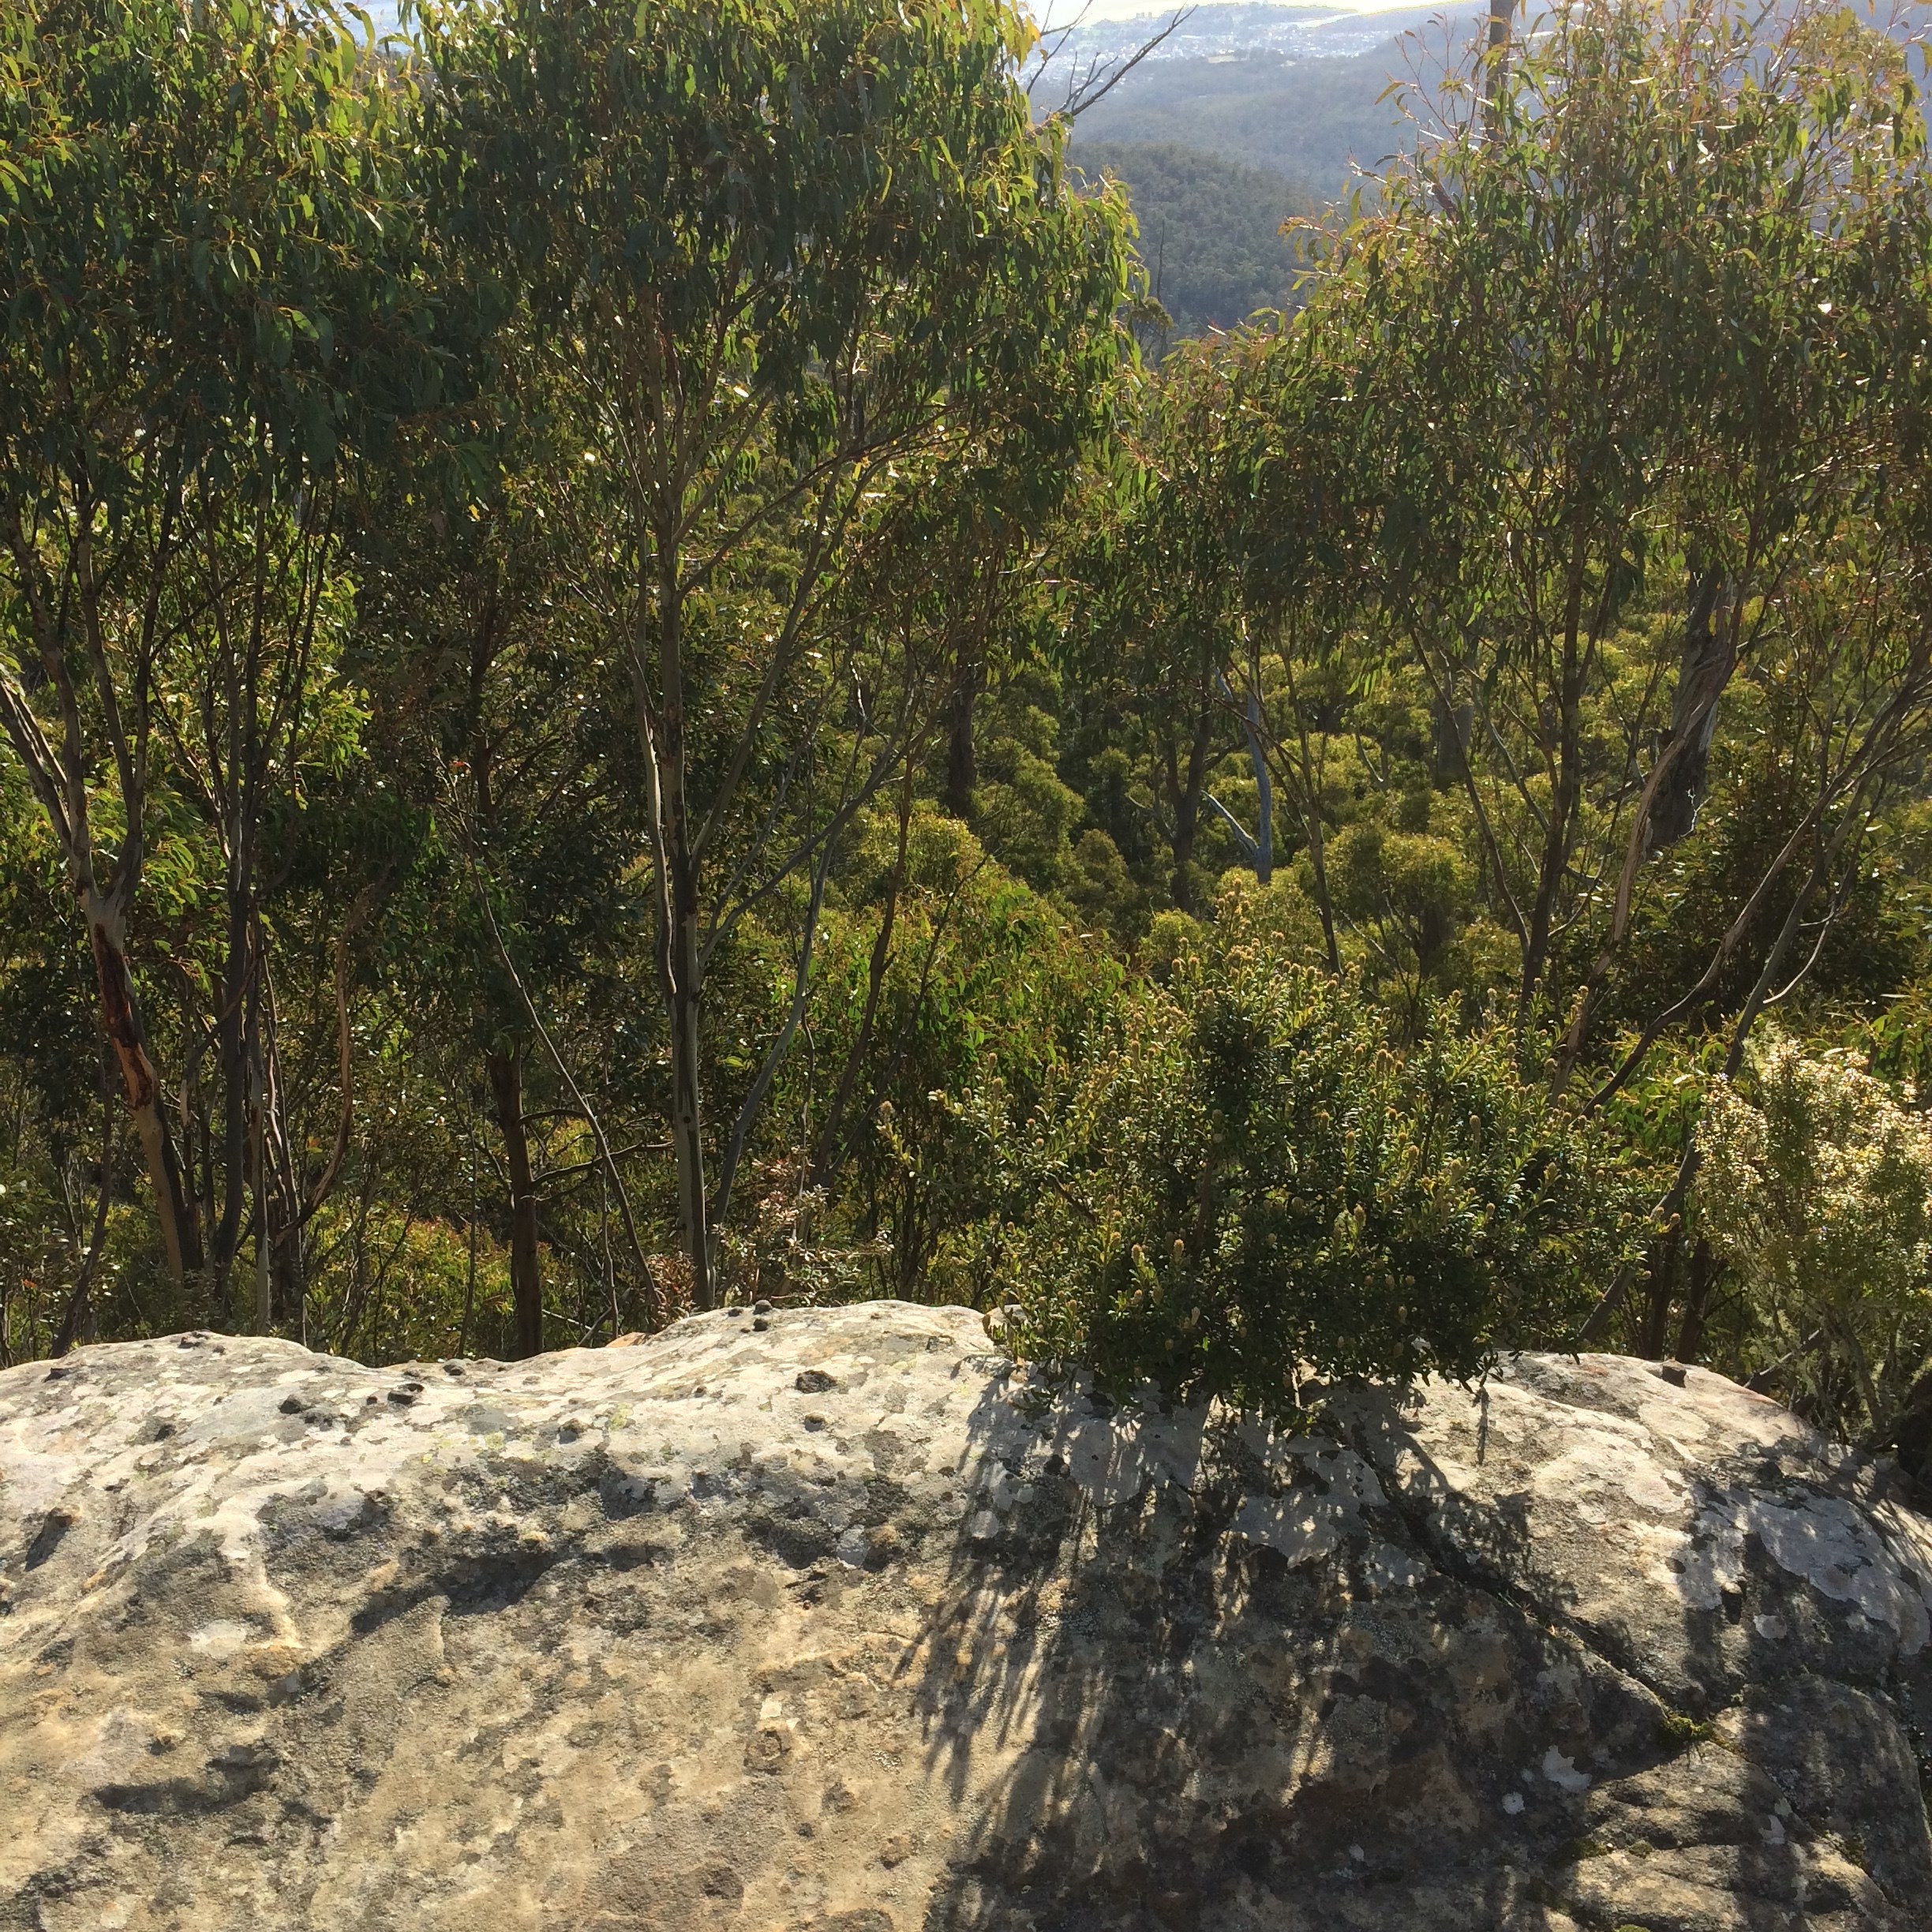
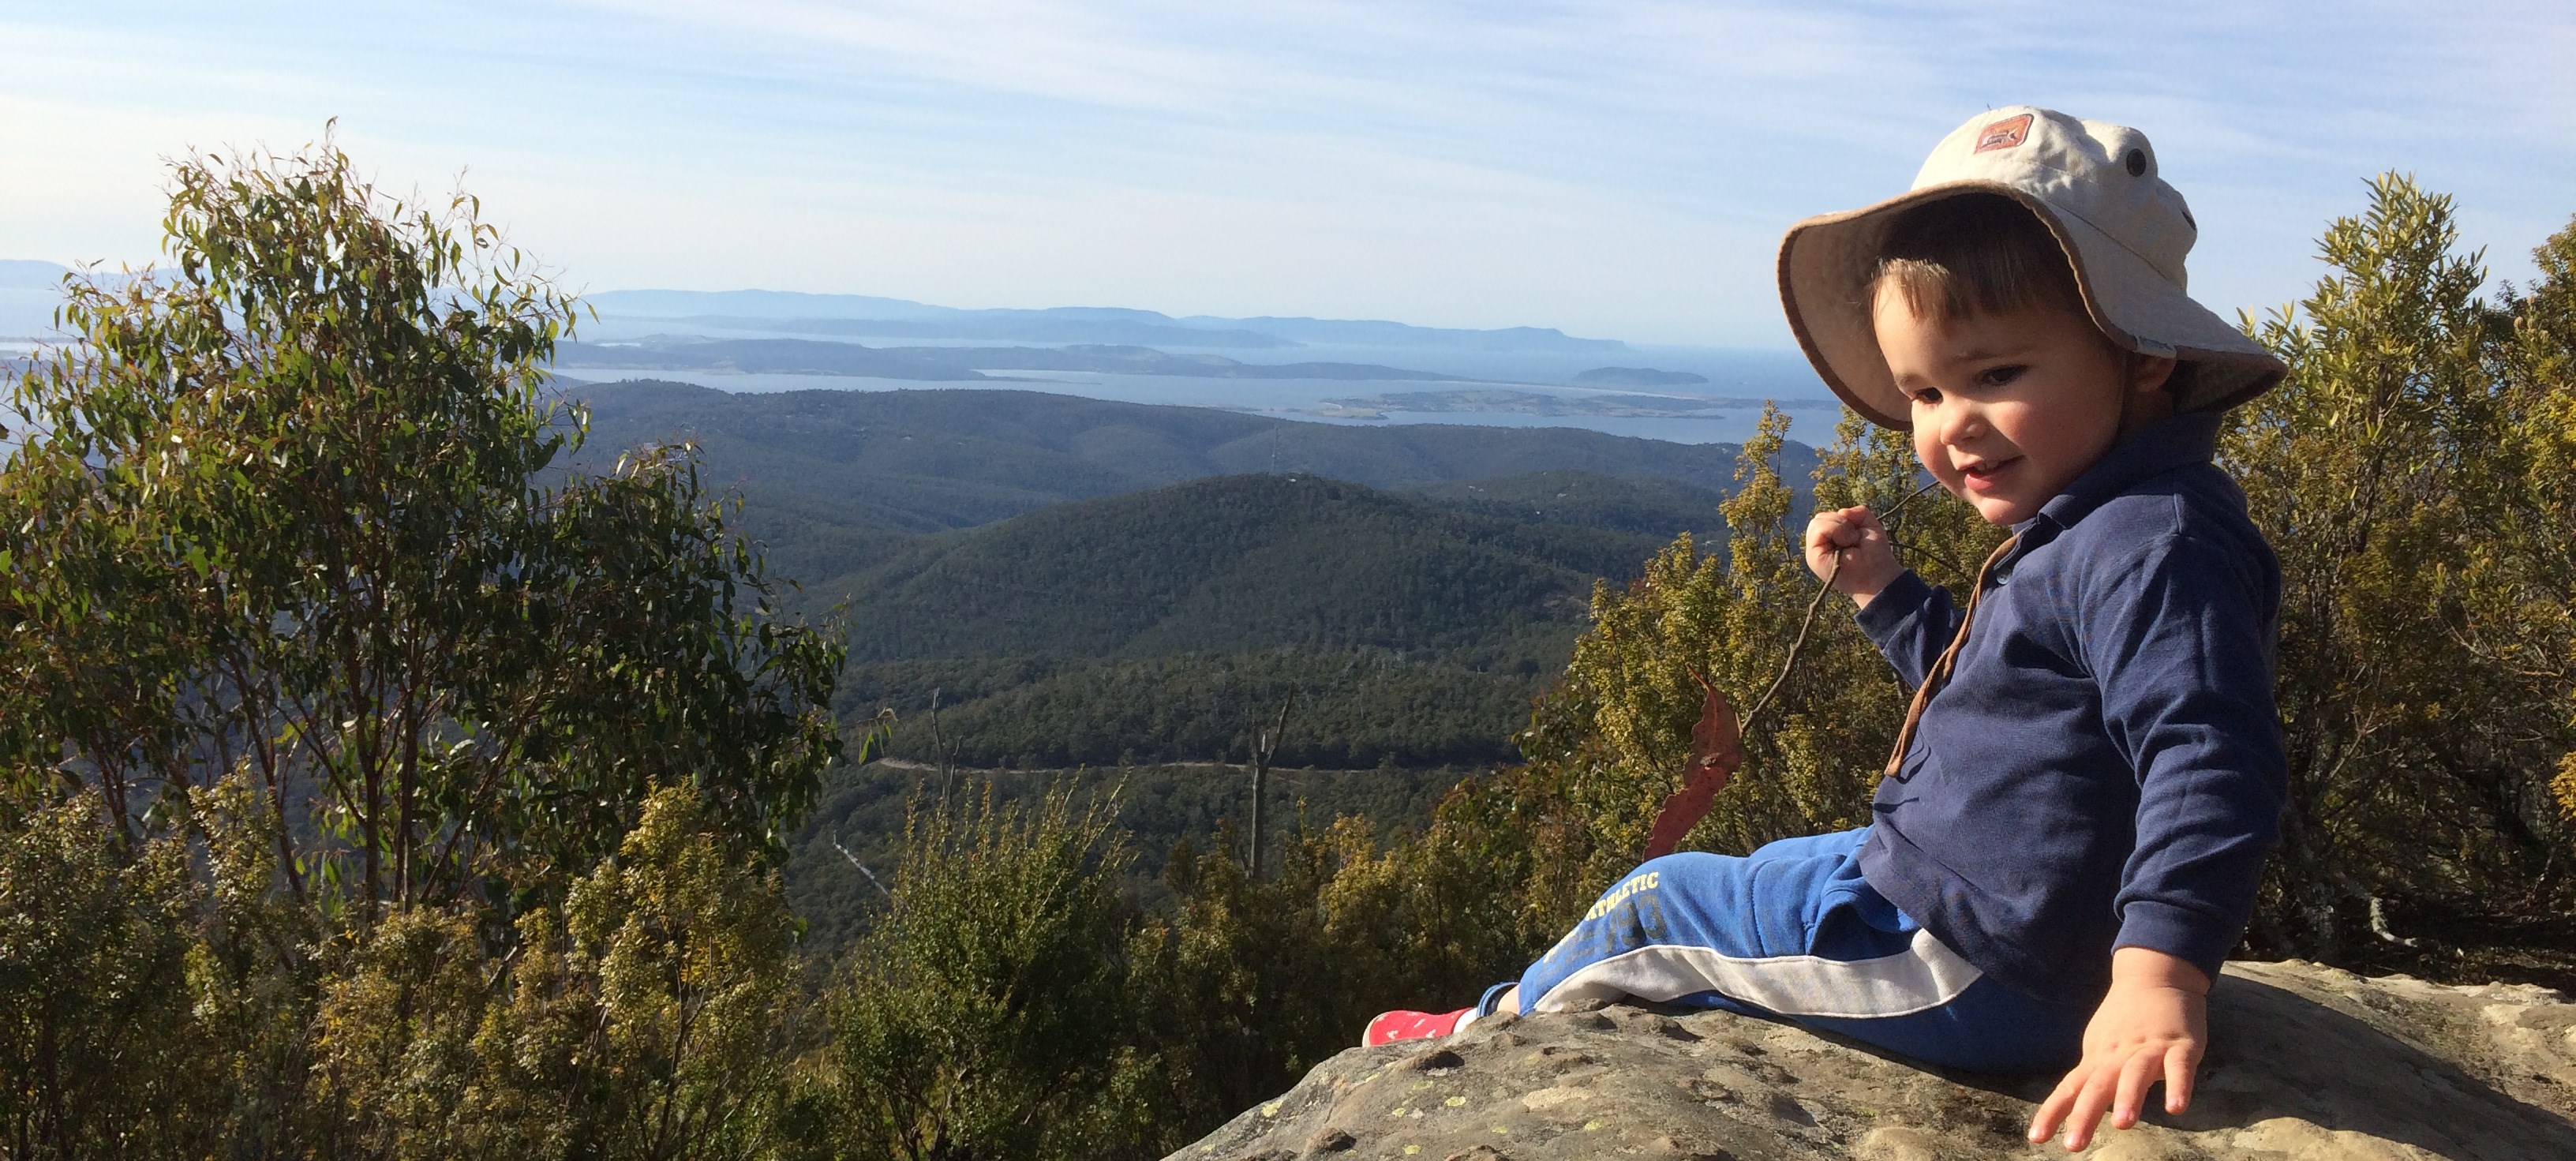
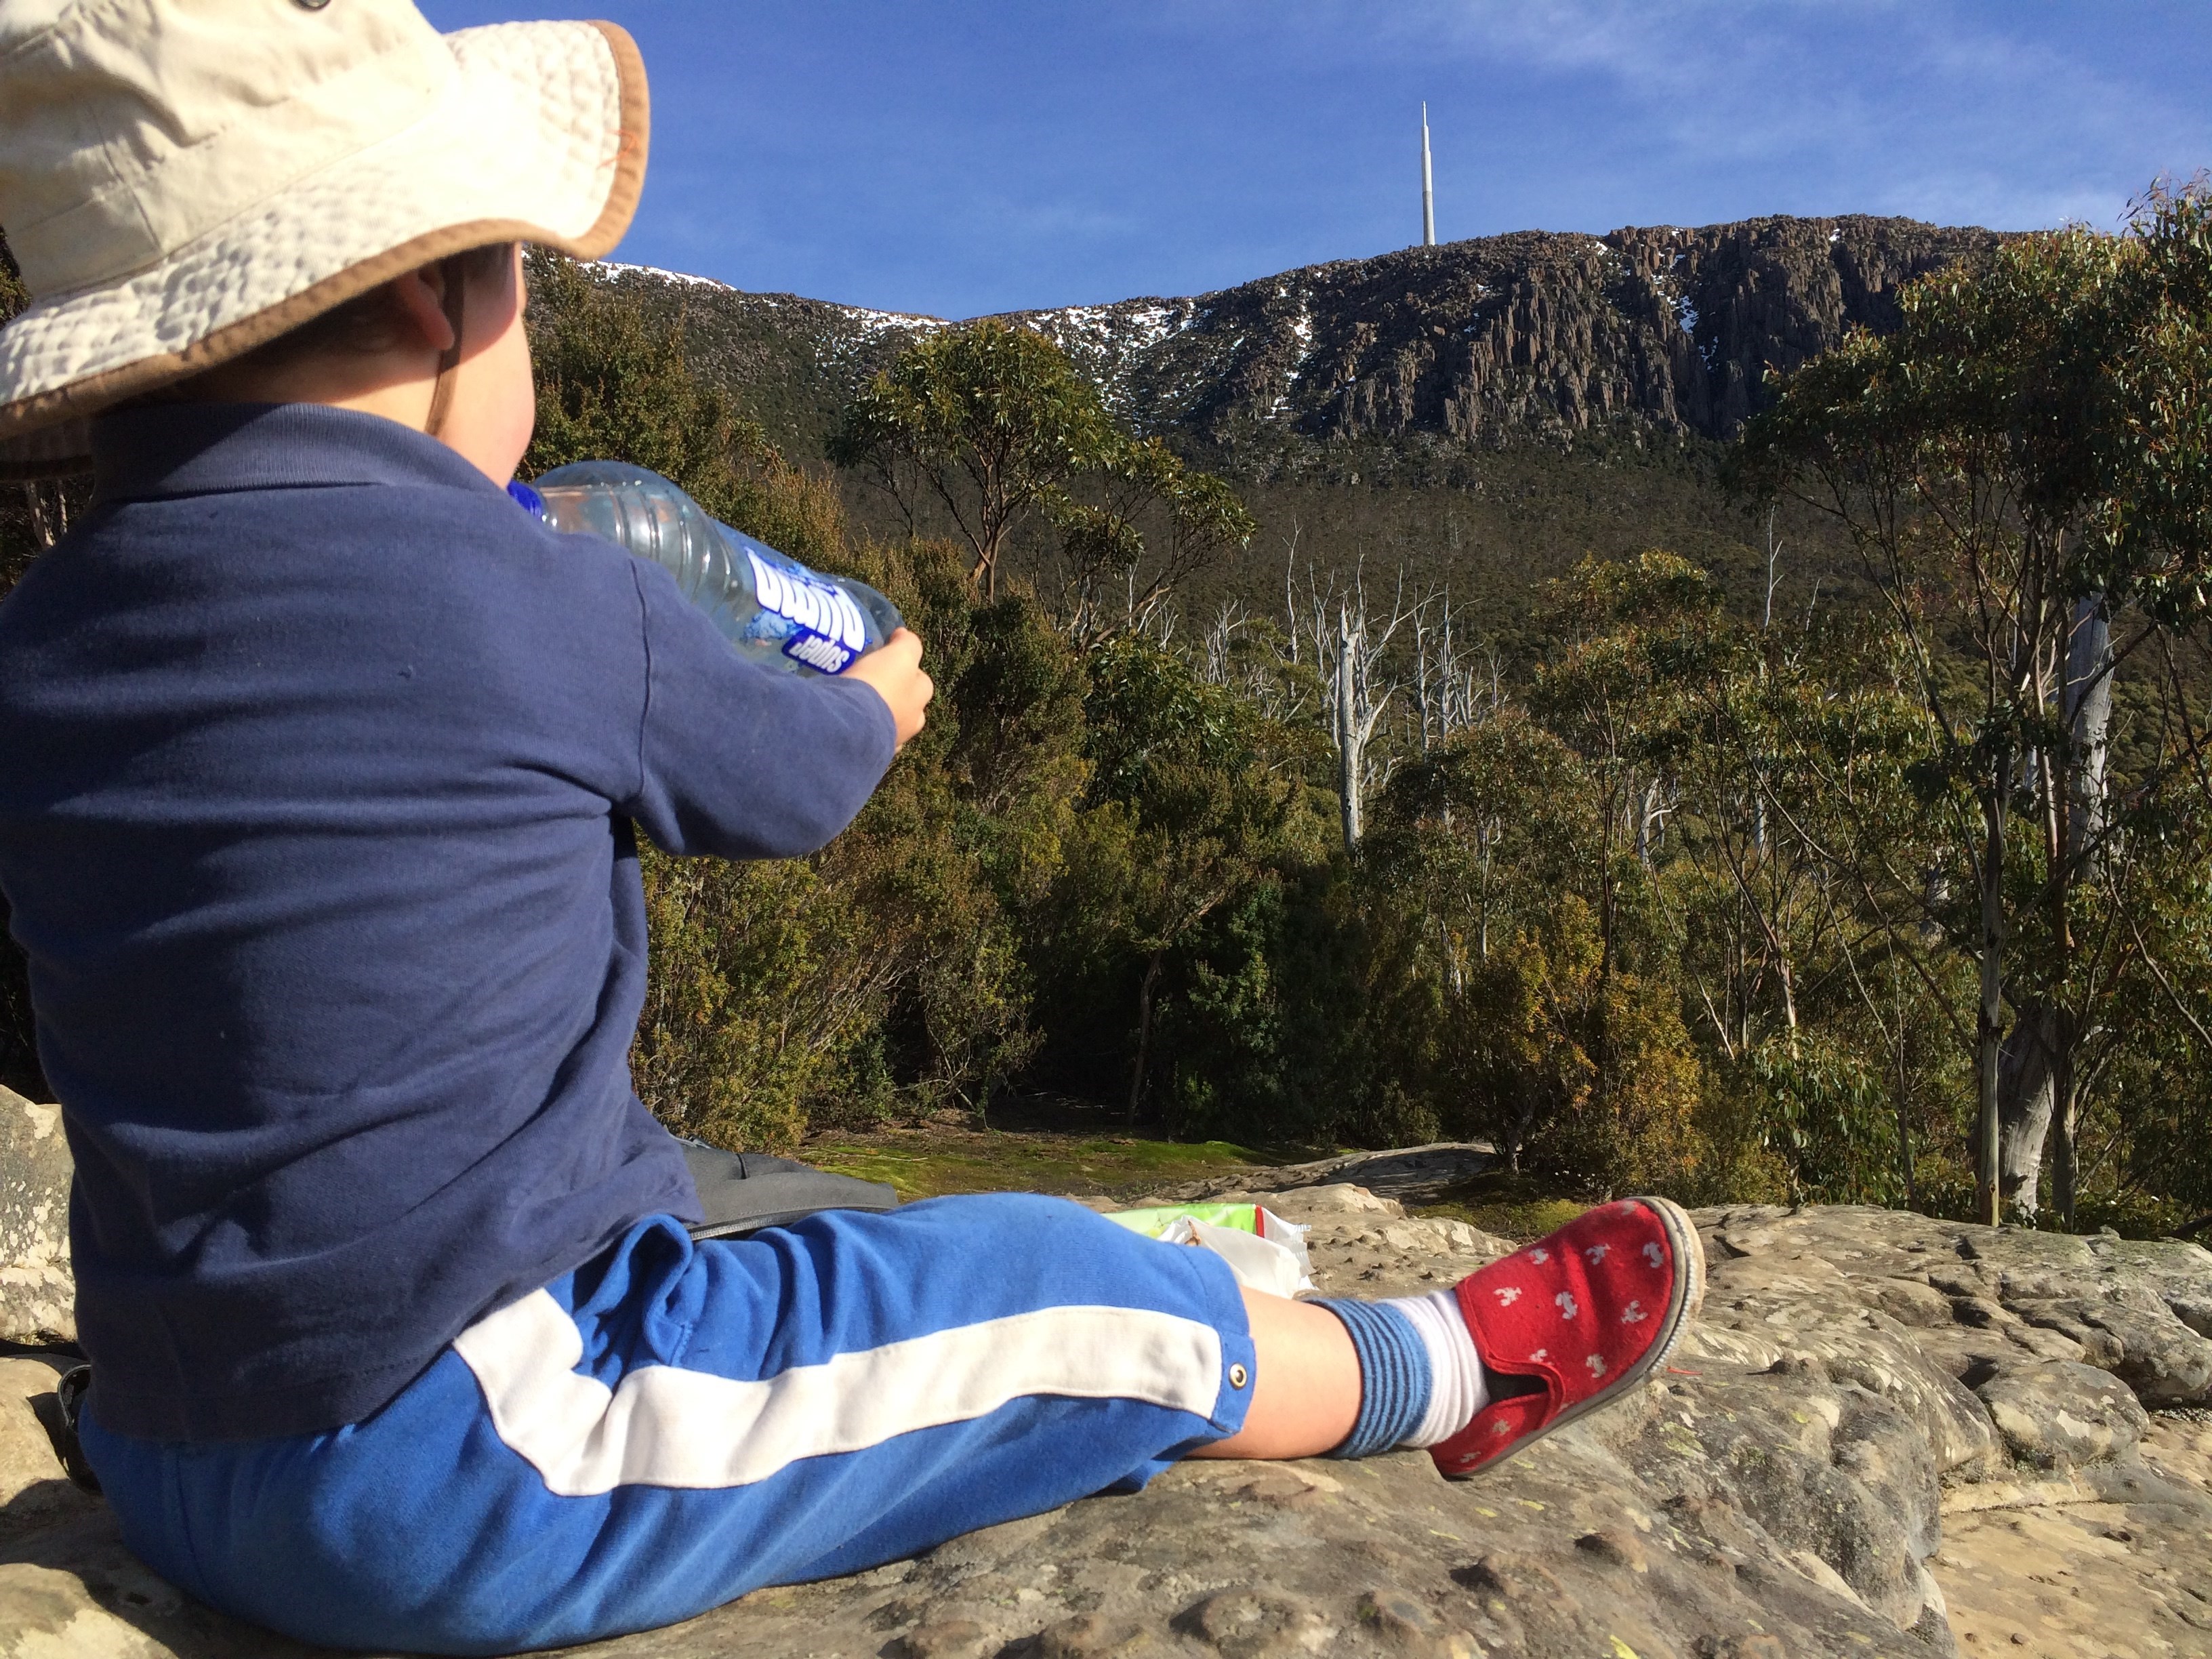
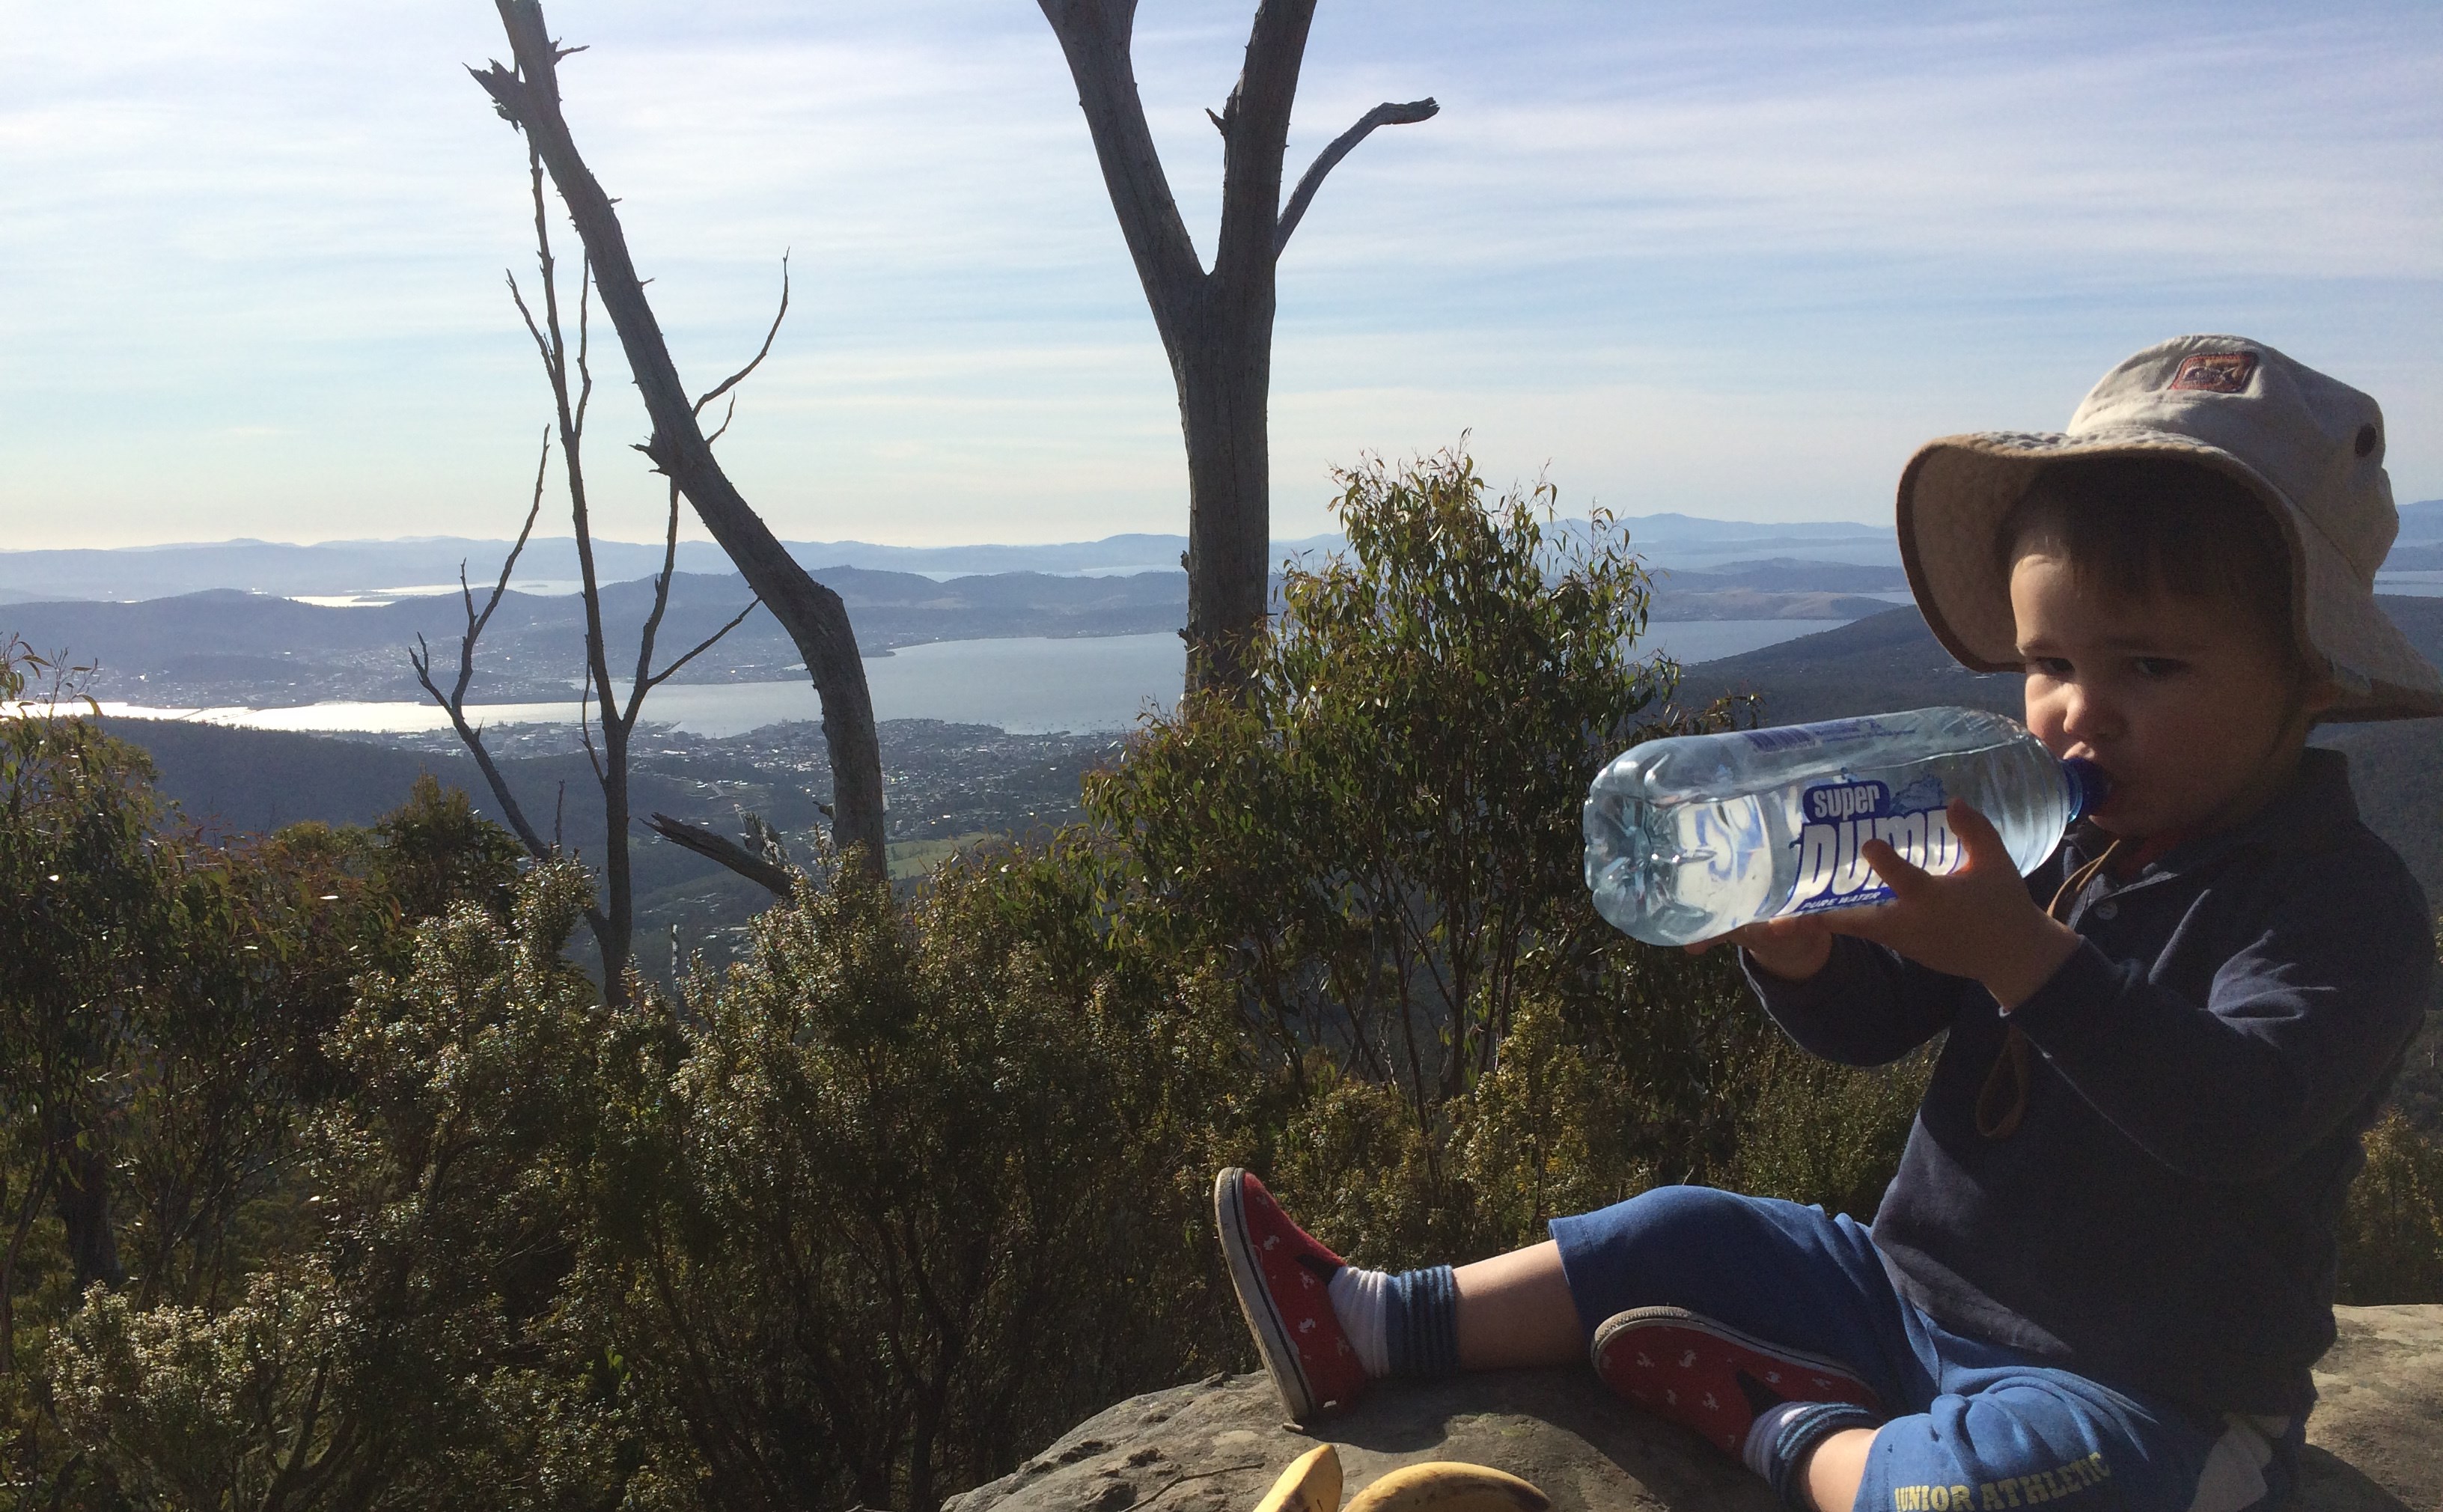
Eventually we made it to the rock, which is gated and seriously signposted for danger. I think we counted 5 signs warning us that THERE BE CLIFFS. We sat down in the early spring sun and basked and ate our morning tea.

The view from Sphinx Rock

We took our time there. I can’t remember when I have last enjoyed sitting in the sun so much. Most of the time, I just get burnt! I was of course pretty careful with Peter, but he was very sensible and stayed well away from the edge.

The cliff Peter and The Mountain Peter and The ViewPeter watches the mountain Peter drinks water with the view

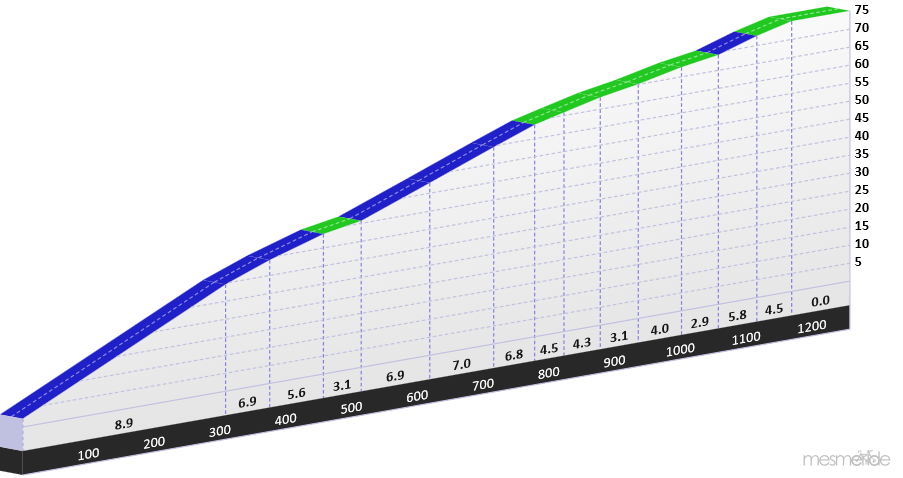
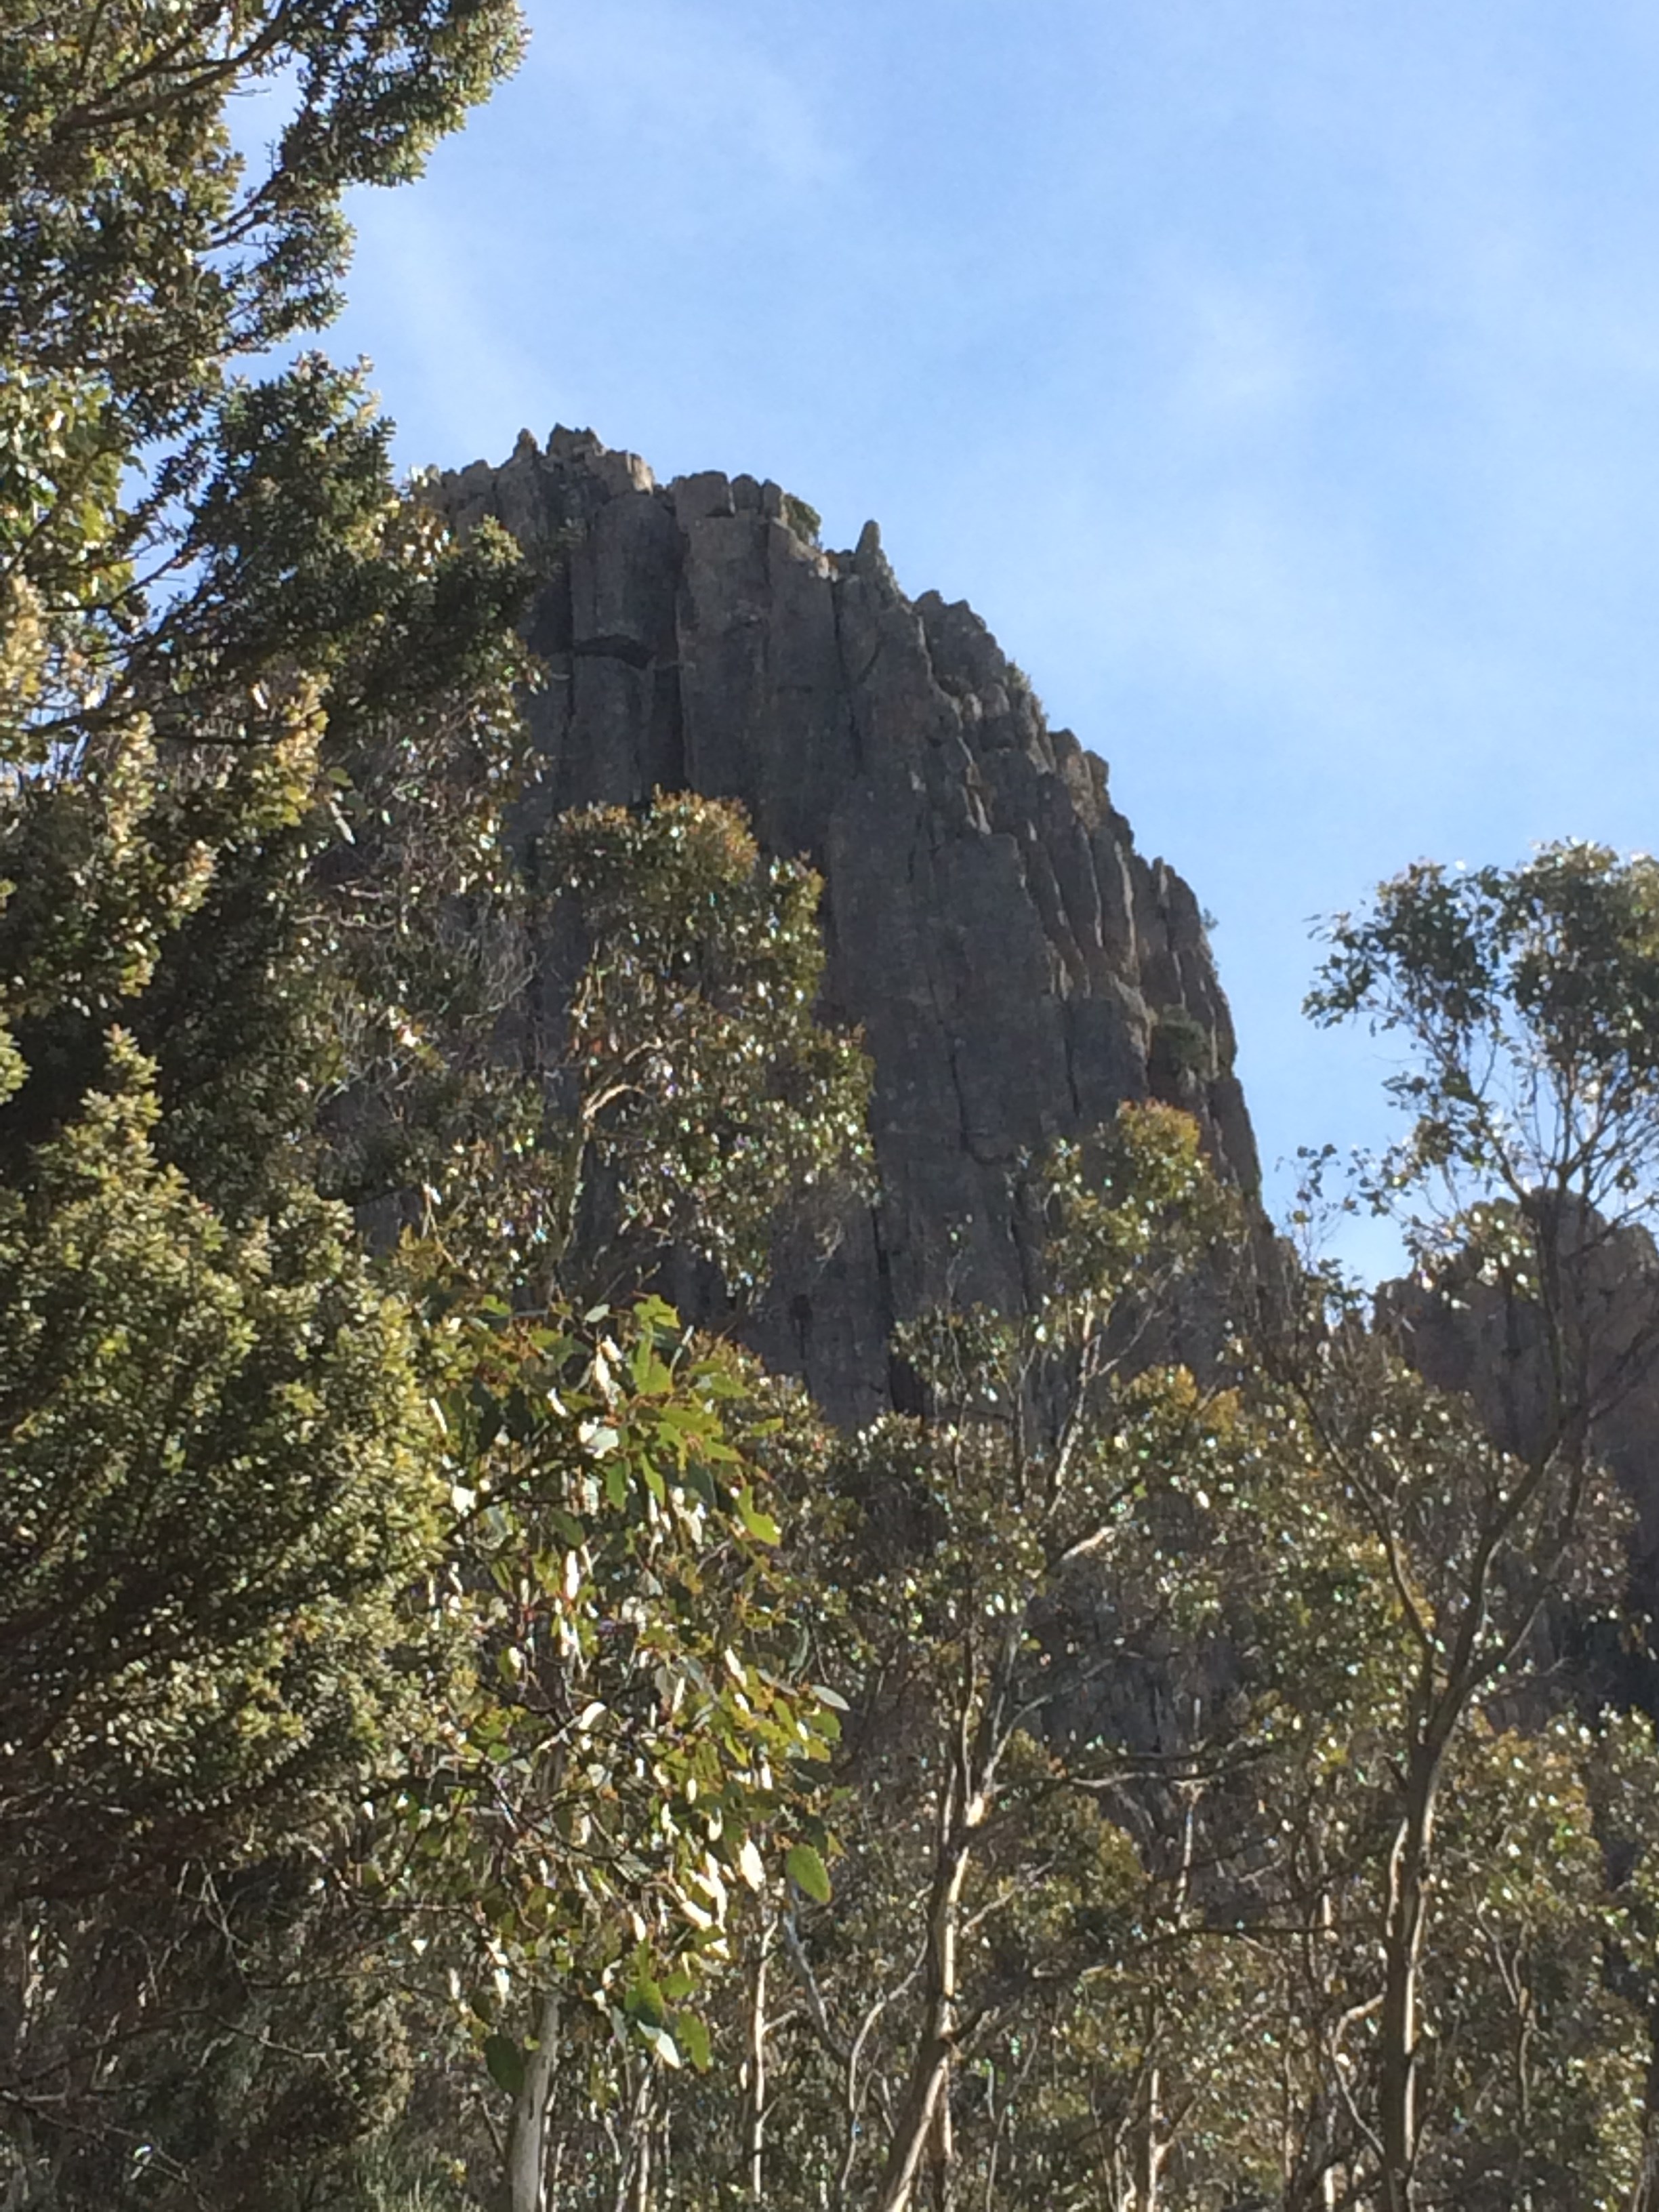
After that, we weren’t ready to head back to the car, so we decided to climb up the Sawmill Track to the Organ Pipes Track. This was a much more challenging track, so Peter traversed it on my shoulders.

Sawmill Track

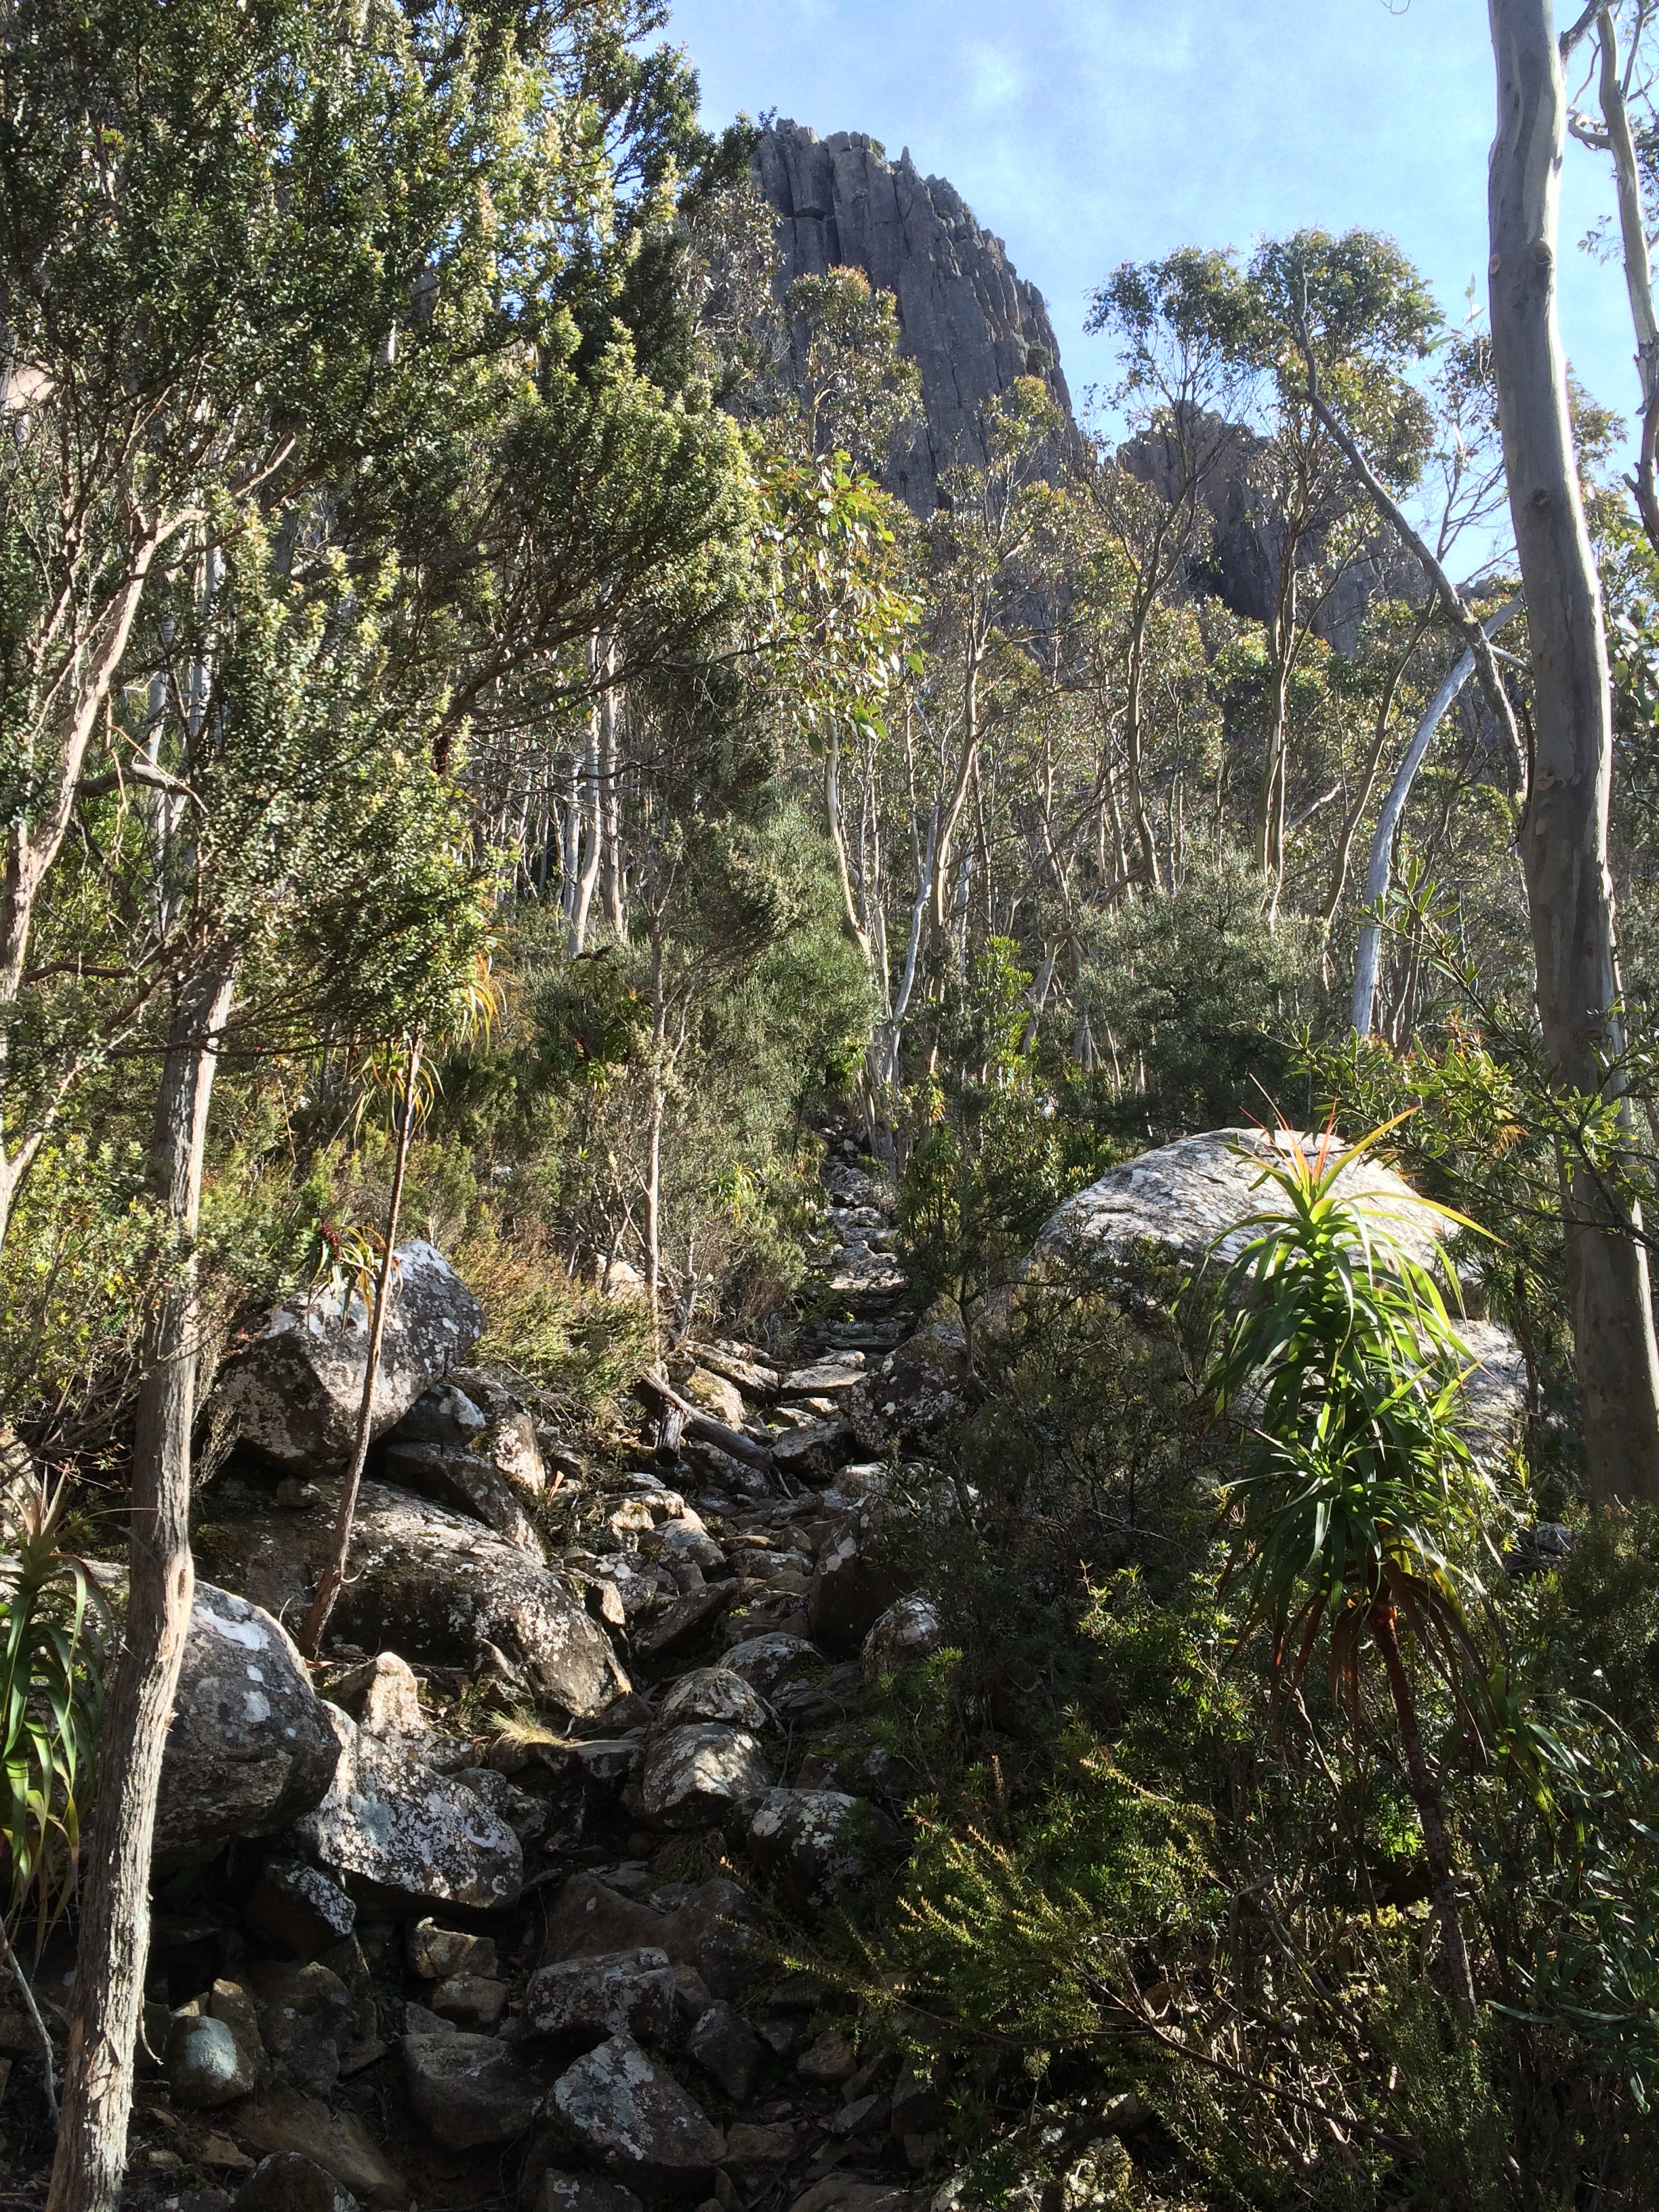
We crossed the road and eventually made it up to the 1000m mark, about where the Organ Pipes Track runs.

The Organ Pipes

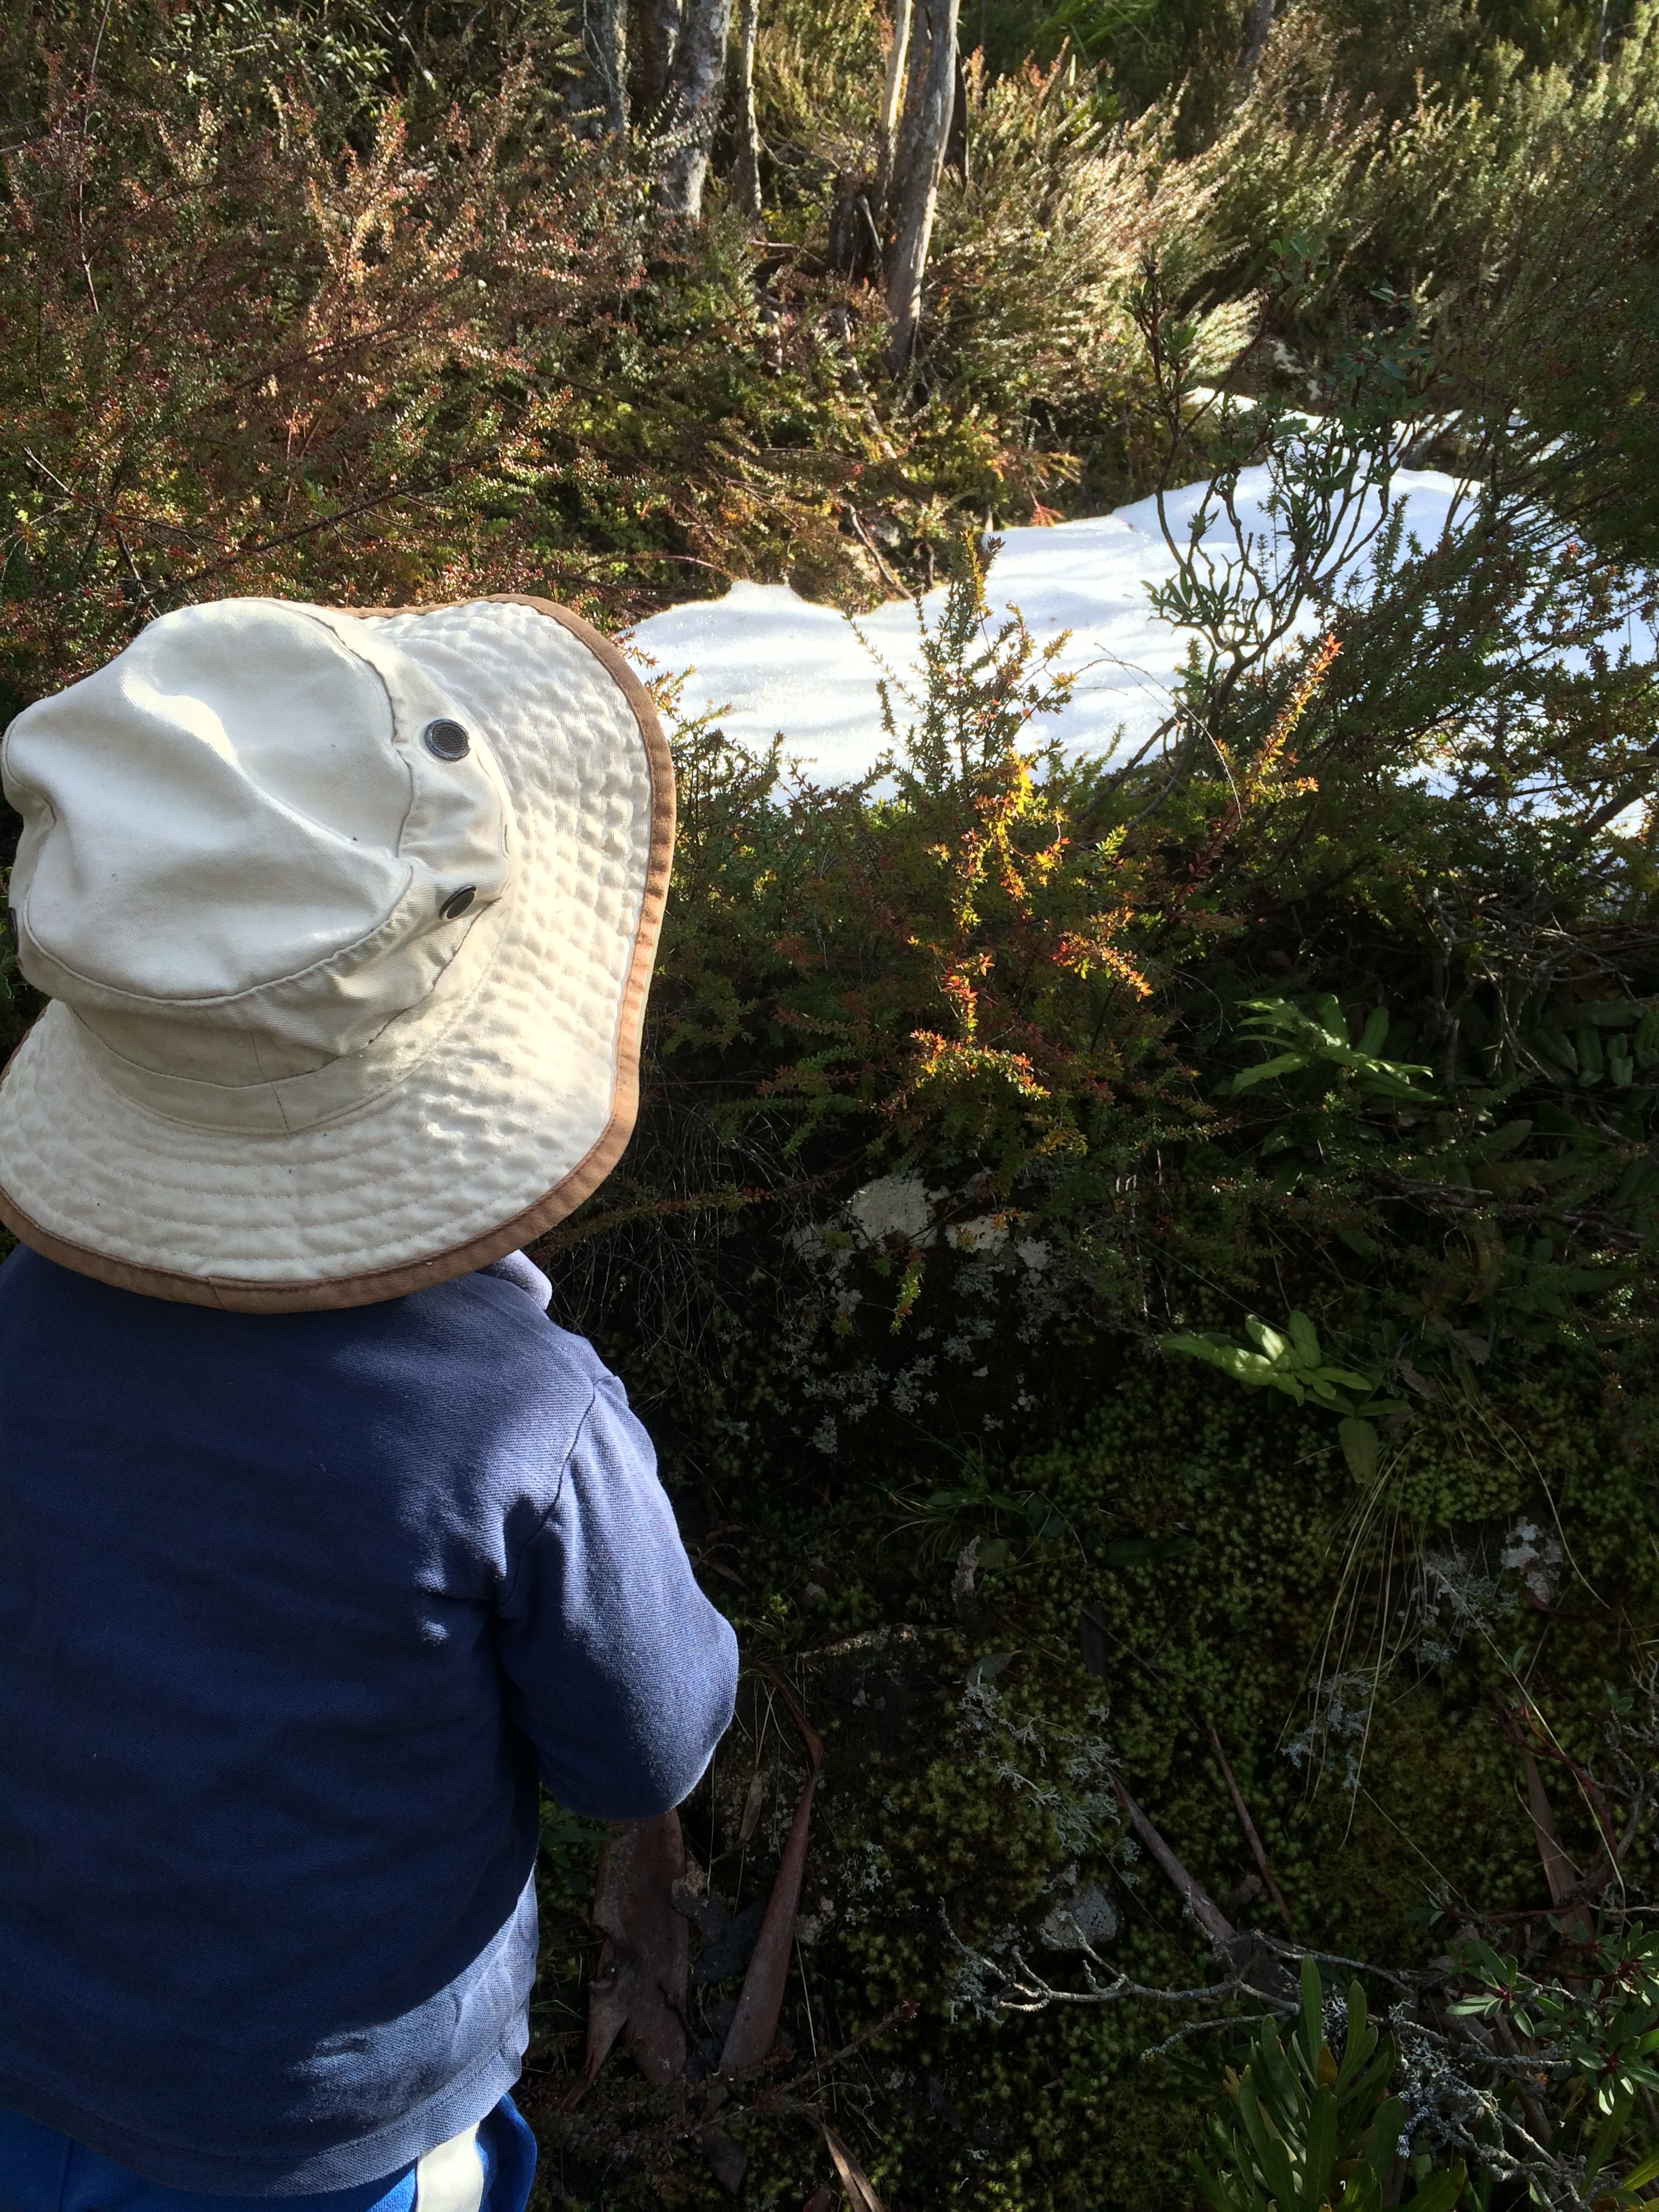
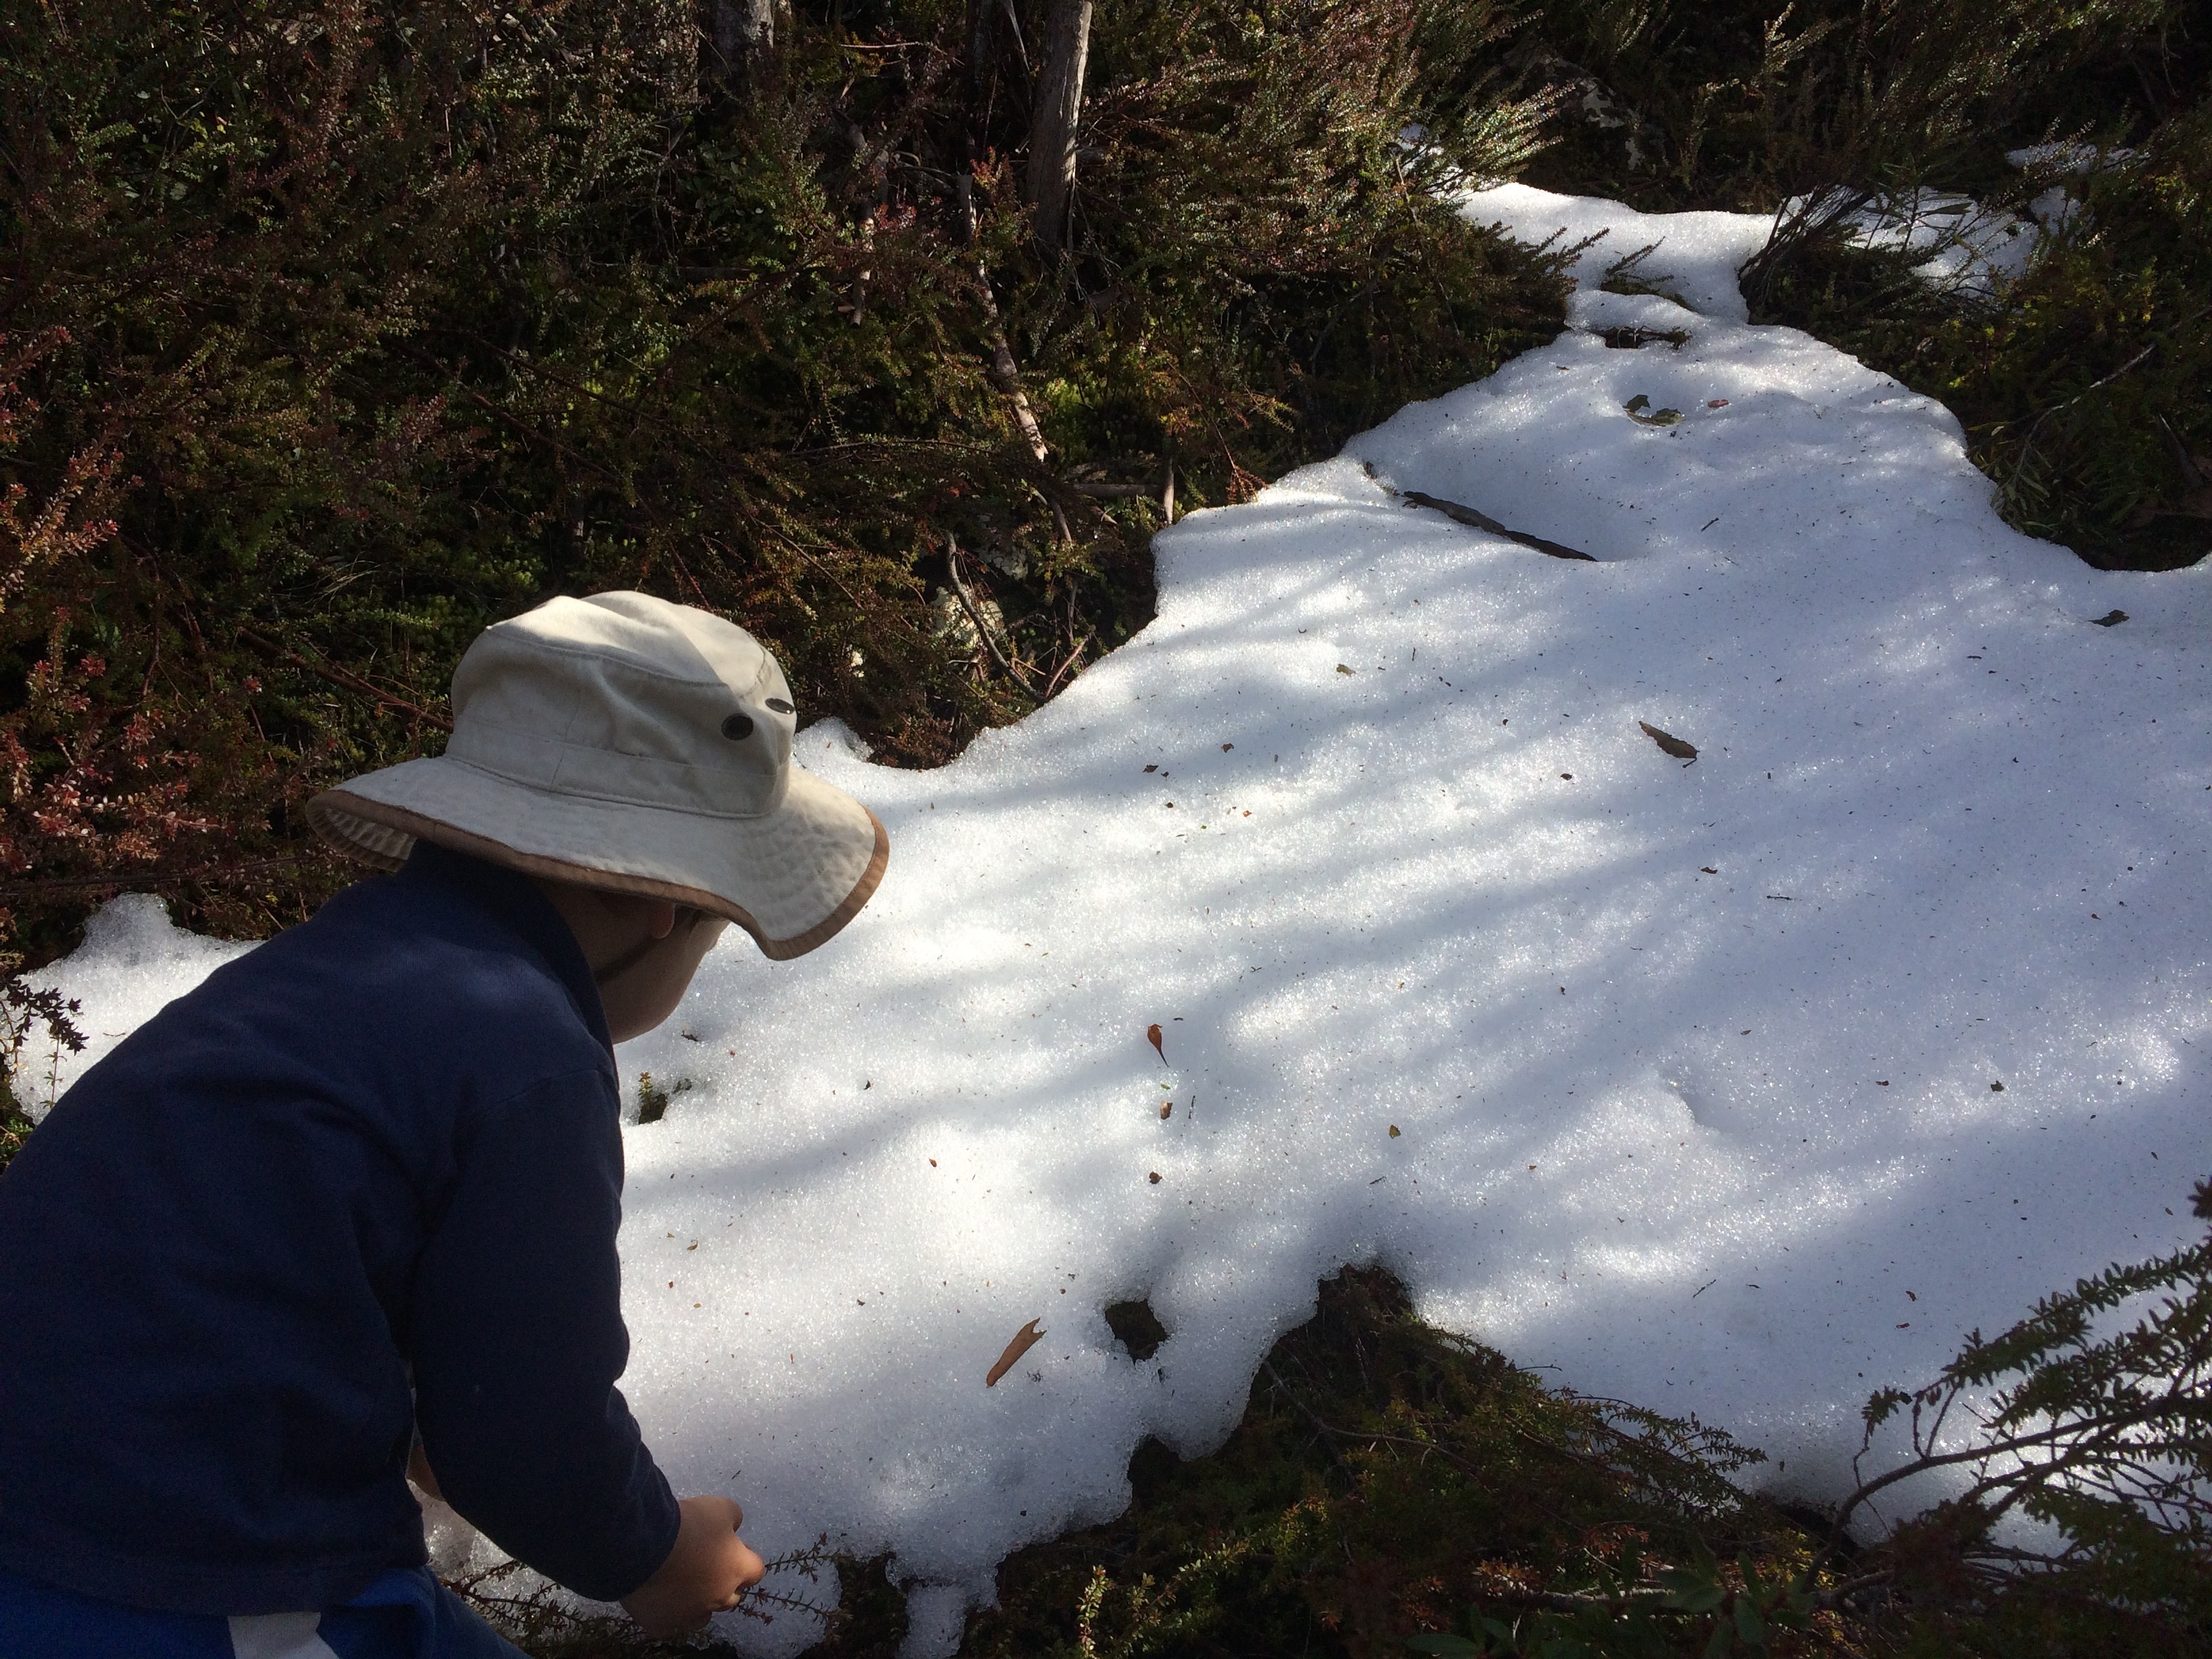
On the Organ Pipes Track we were excited to find snow! Peter was very pleased and ate a nice handful.

Snow! Eat some snow!

After that, he spent some time on my shoulders, and some walking, and climbing over rocks, as we made our way back to the car.

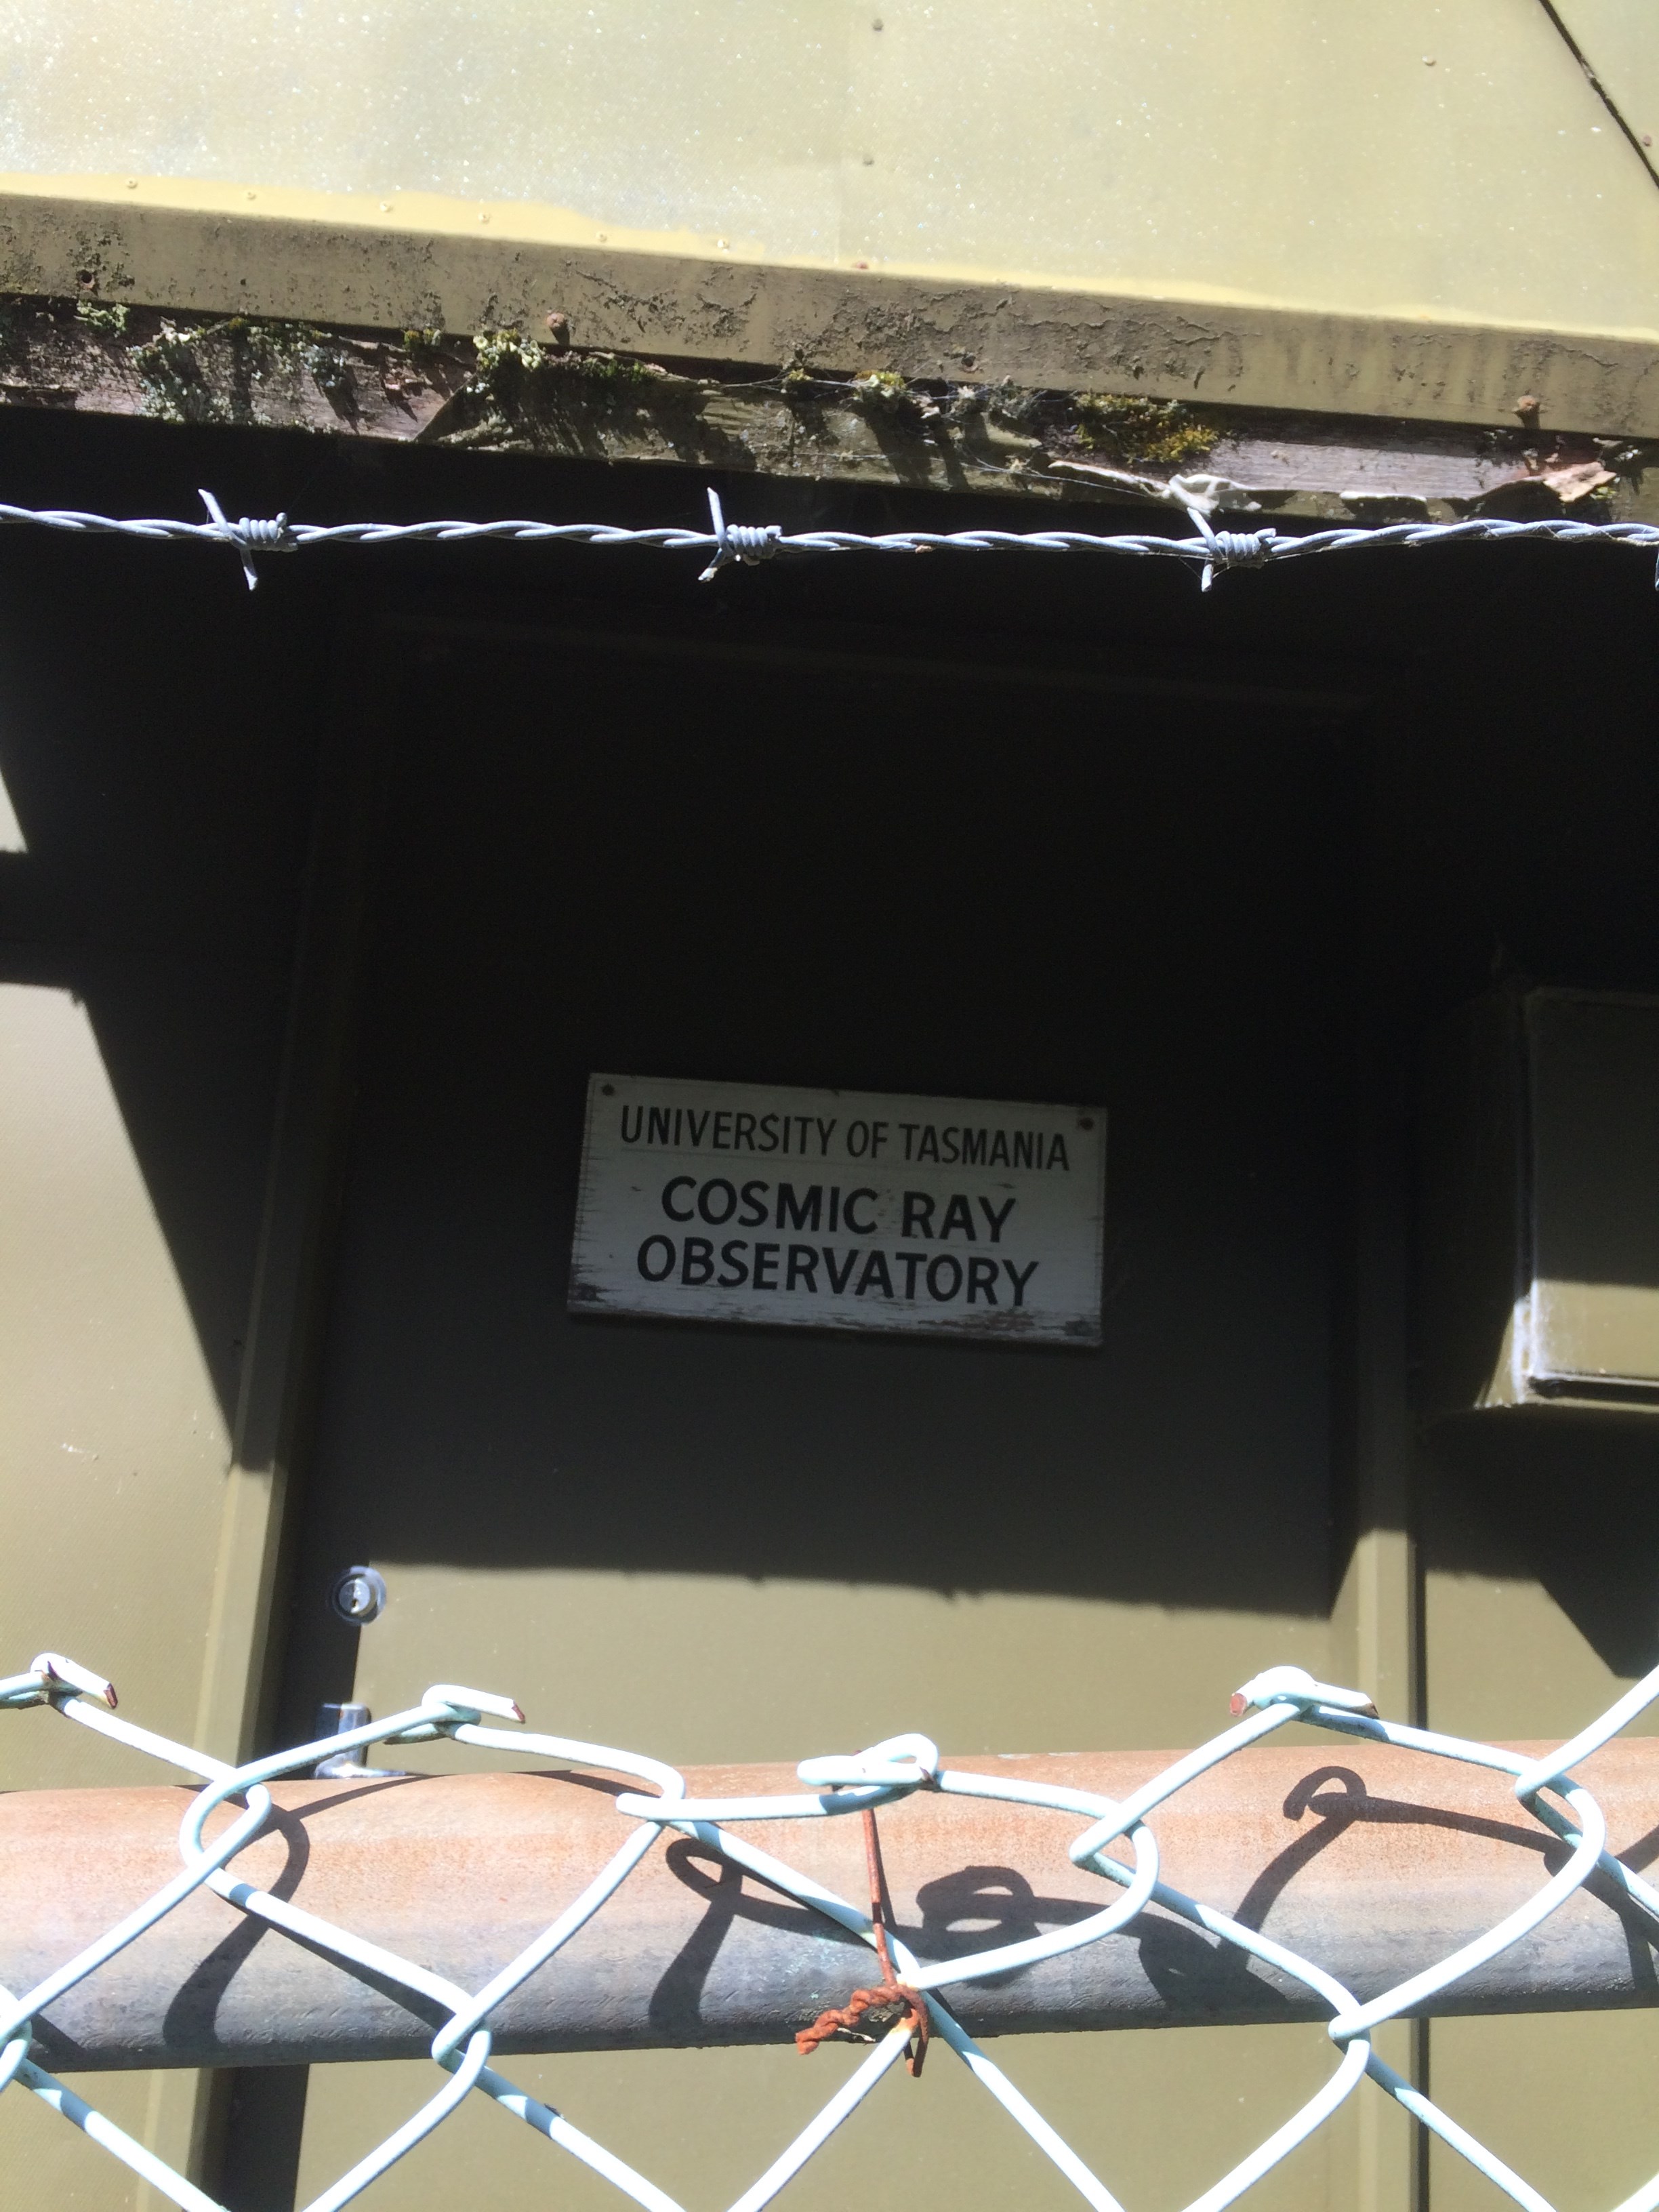
Near The Springs, we saw a triangular shaped building. I expected it to be a utility building of some kind but it turned out to be a Cosmic Ray Observatory. That’s pretty cool.

This building turned out to be interesting

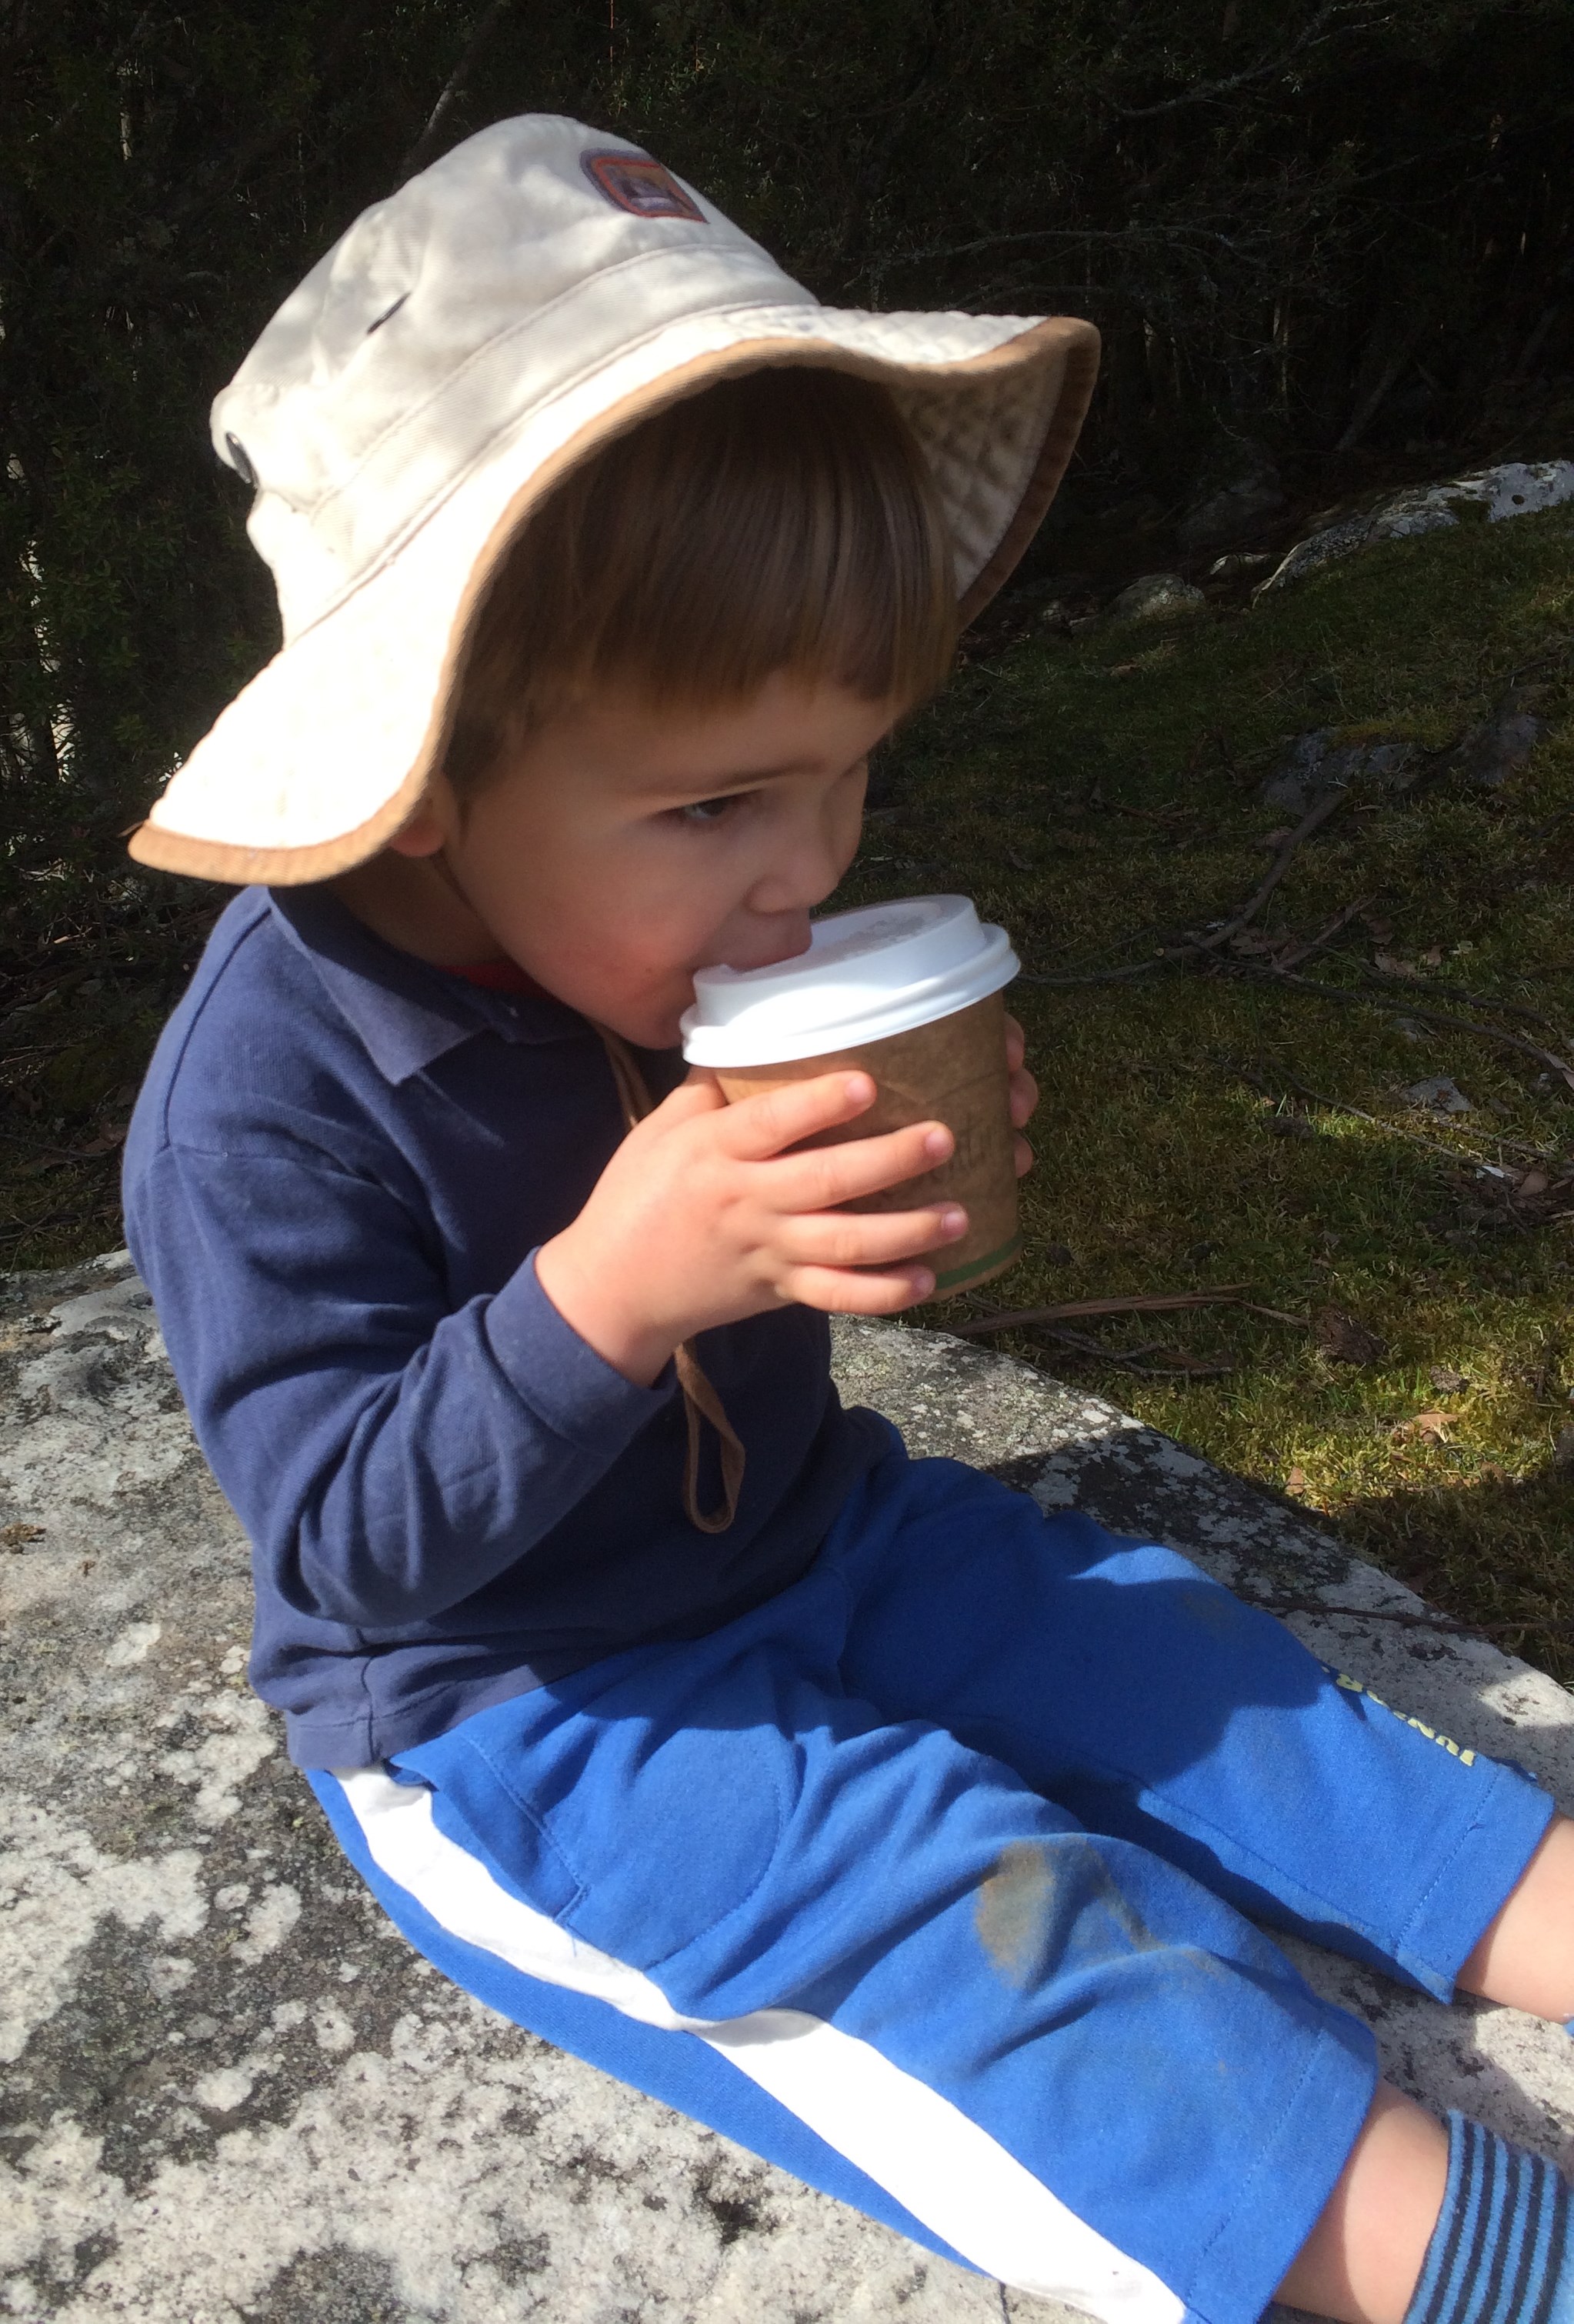
Finally, we treated ourselves to a coffee and a babycino.

Babycino time

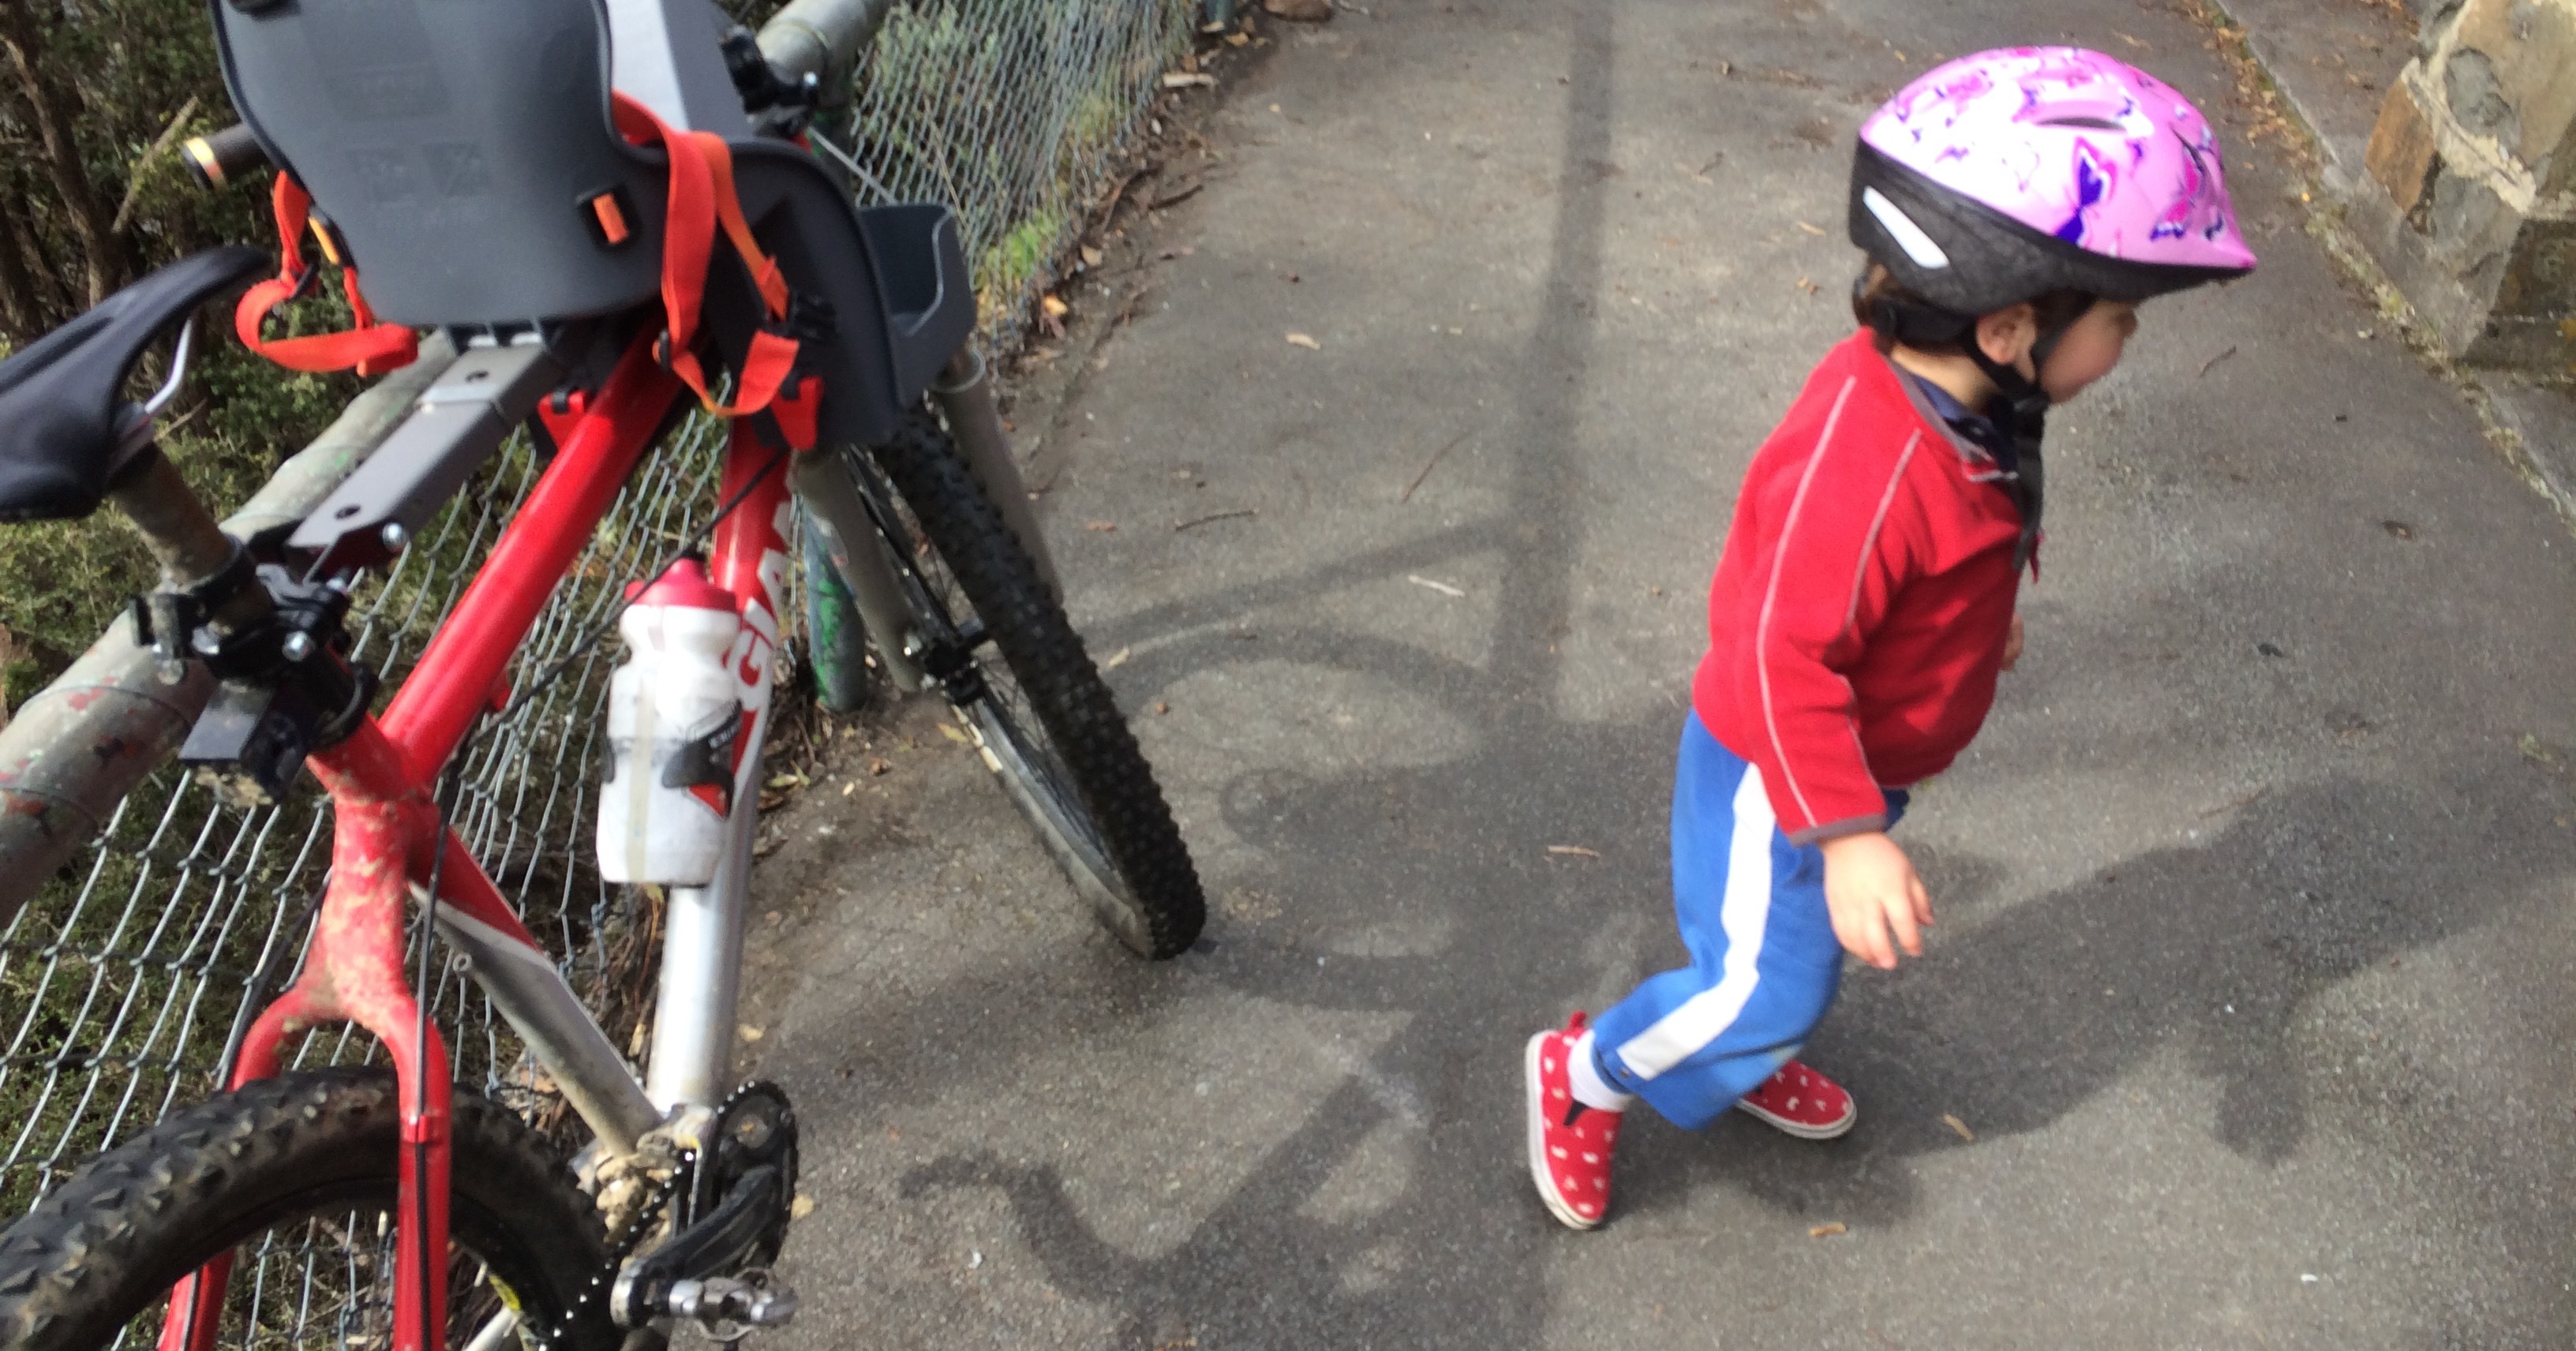
A Bike Ride to The Chalet

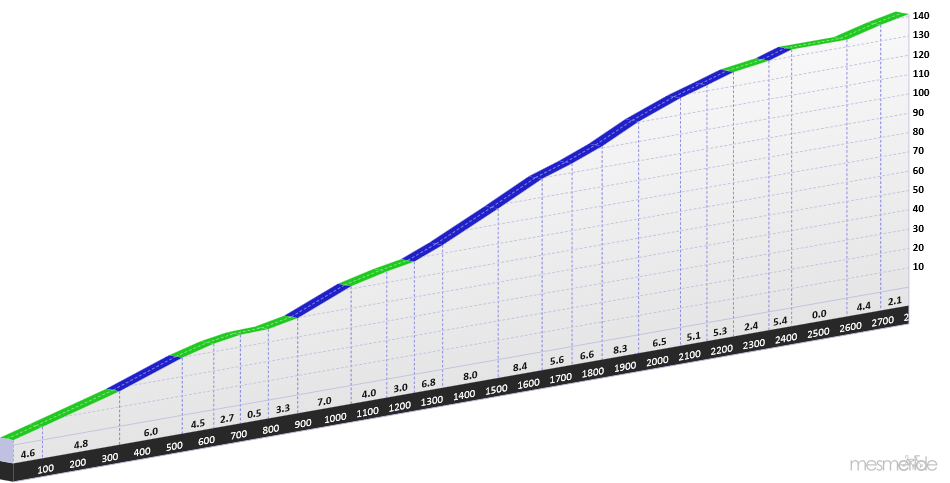
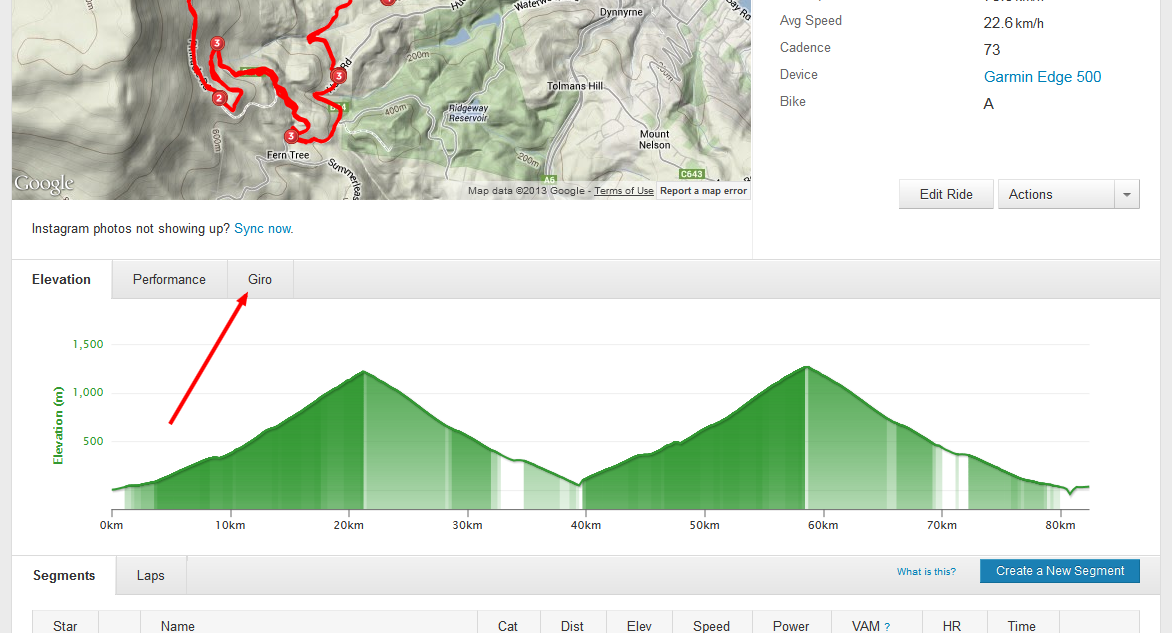
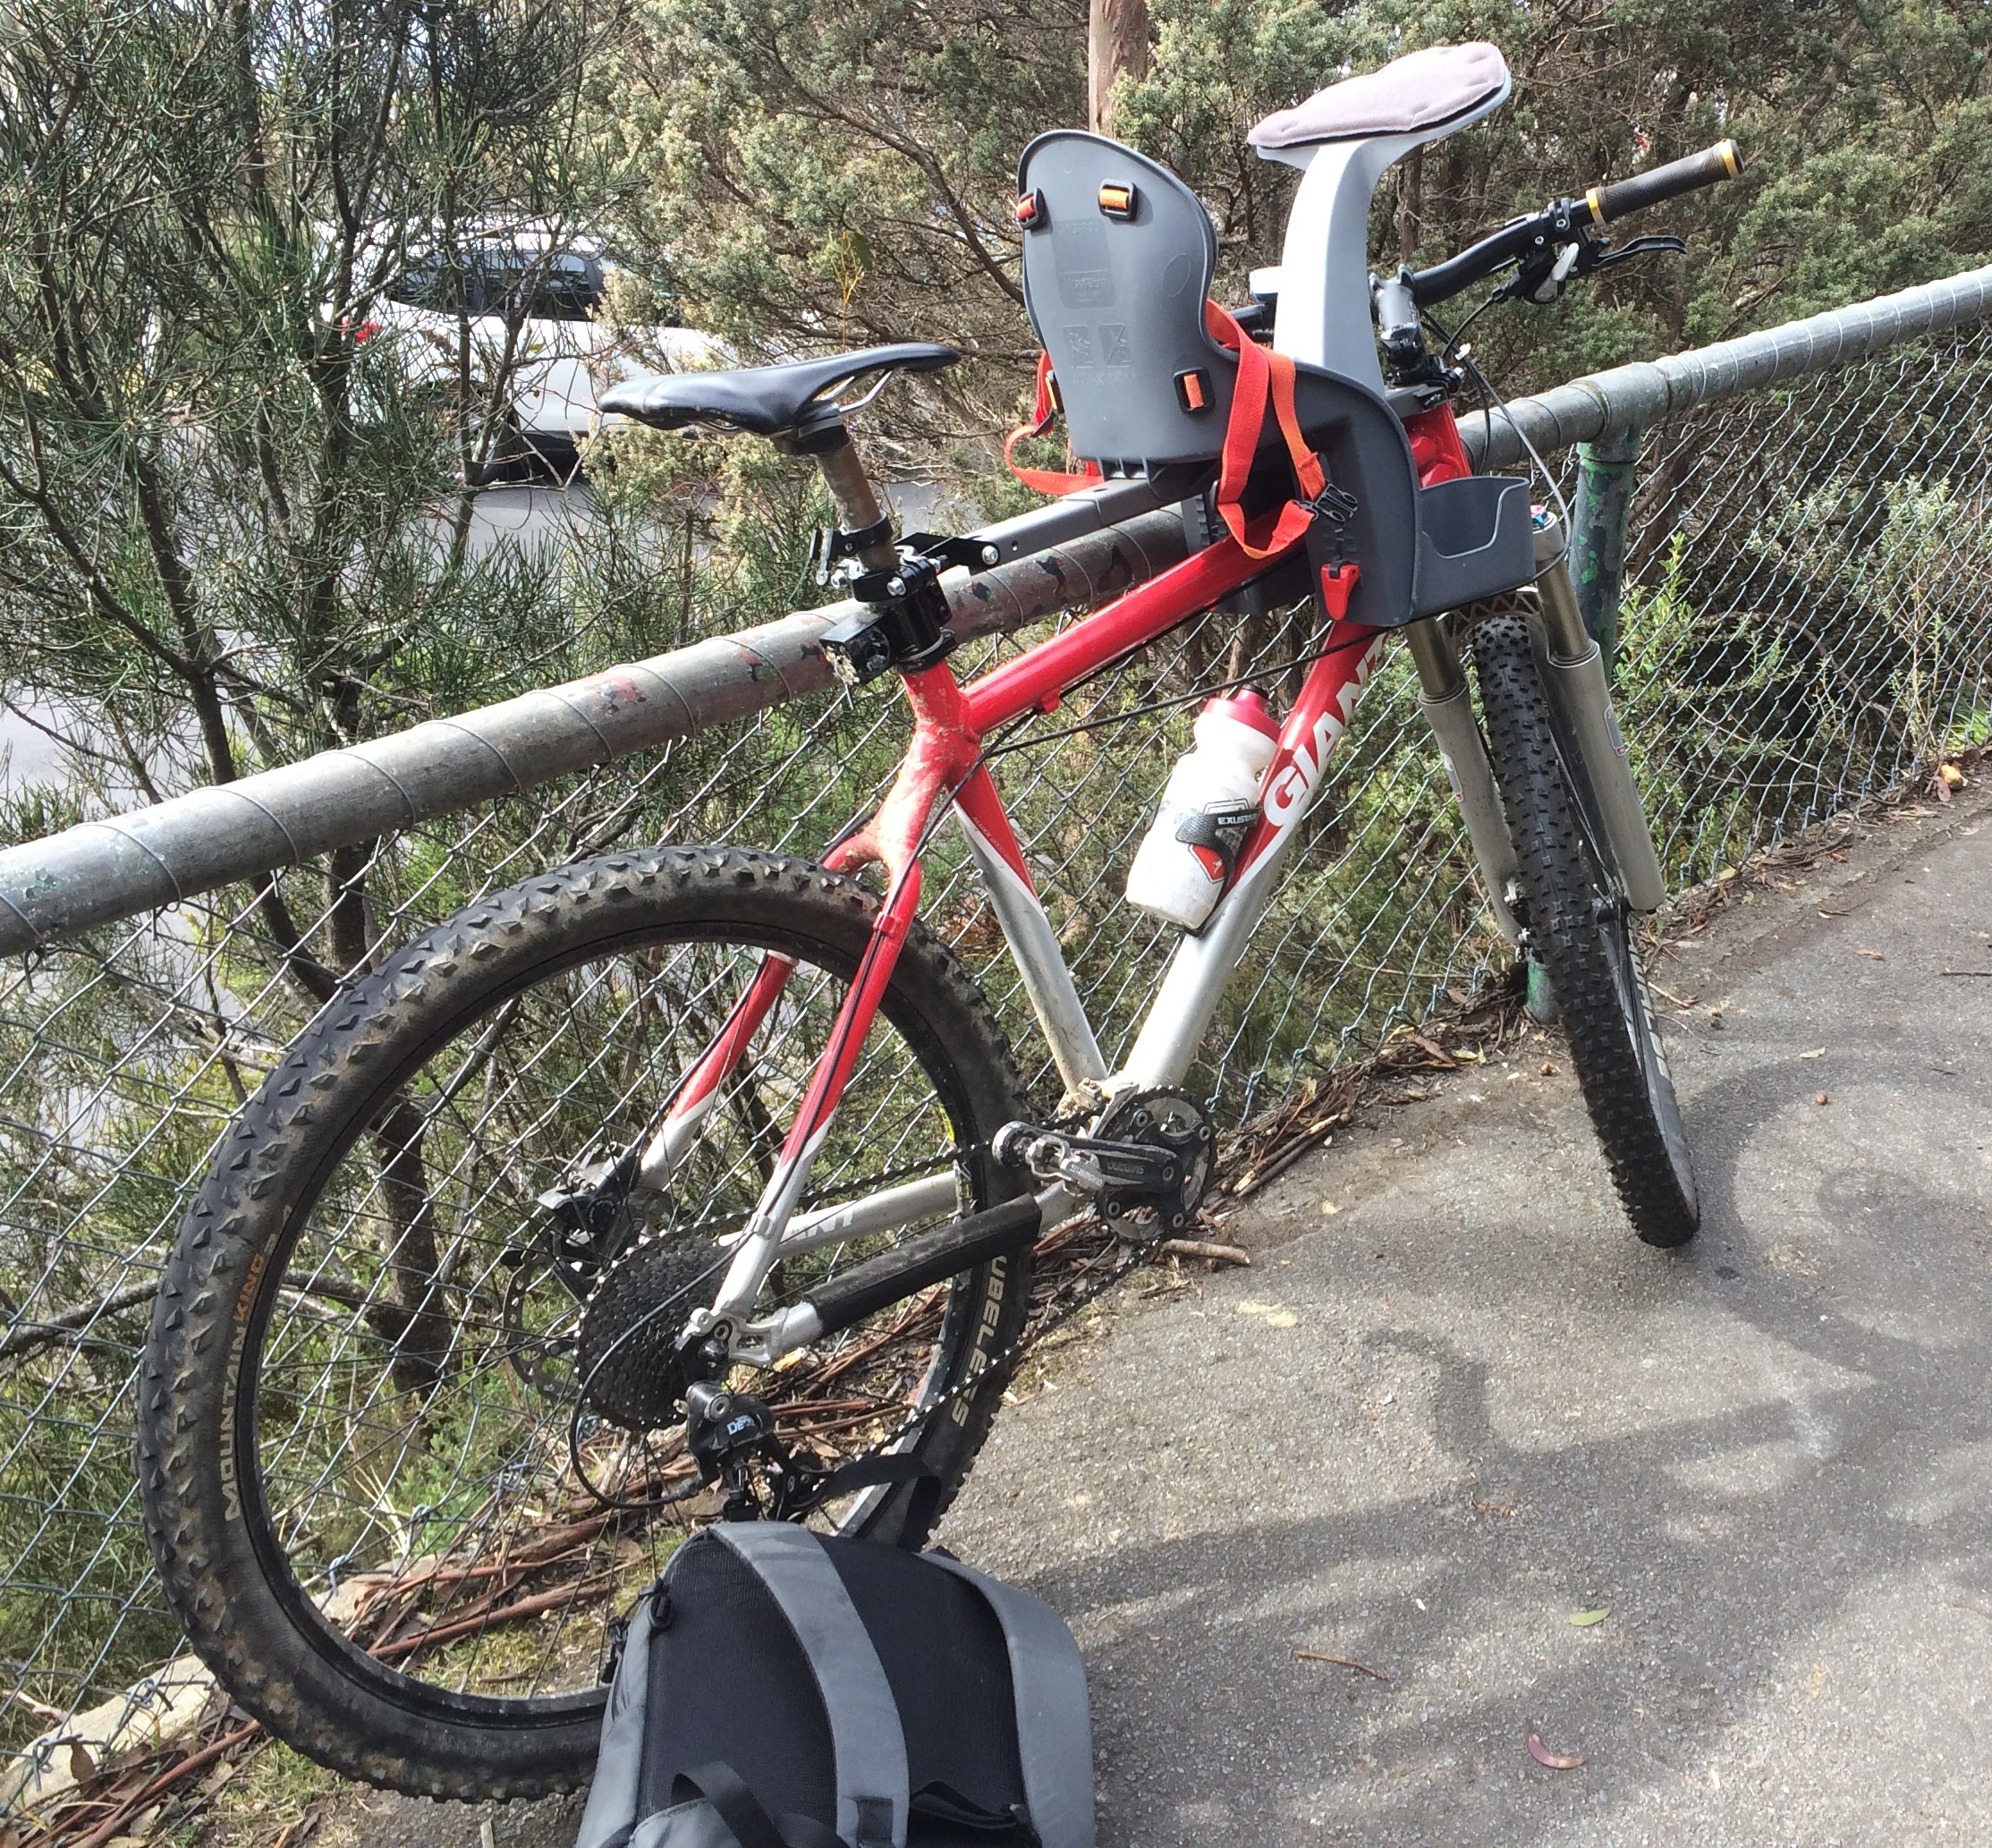
Later that day, we decided to go on a ride, from our house in Ridgeway. The weather was still good, so we rode back up the mountain, past The Springs, all the way to The Chalet, at 1000m, at the far end of the Organ Pipes Track. It was a bit funny to be riding past the same areas we’d walked that morning, but the mountain was nearby and was beckoning.

Riding up the mountain is hard work with a baby seat on the front! The seat stops you from getting out of the saddle, and you have to ride with your knees out like you are a cowboy or something, which gets a bit uncomfortable. I was glad to pause at The Springs to get some food out of the pack for Peter, and even more glad after the last 100m to The Chalet, where the wind picked up and ever so nearly brought us to a complete stop!

At The Chalet Our steed

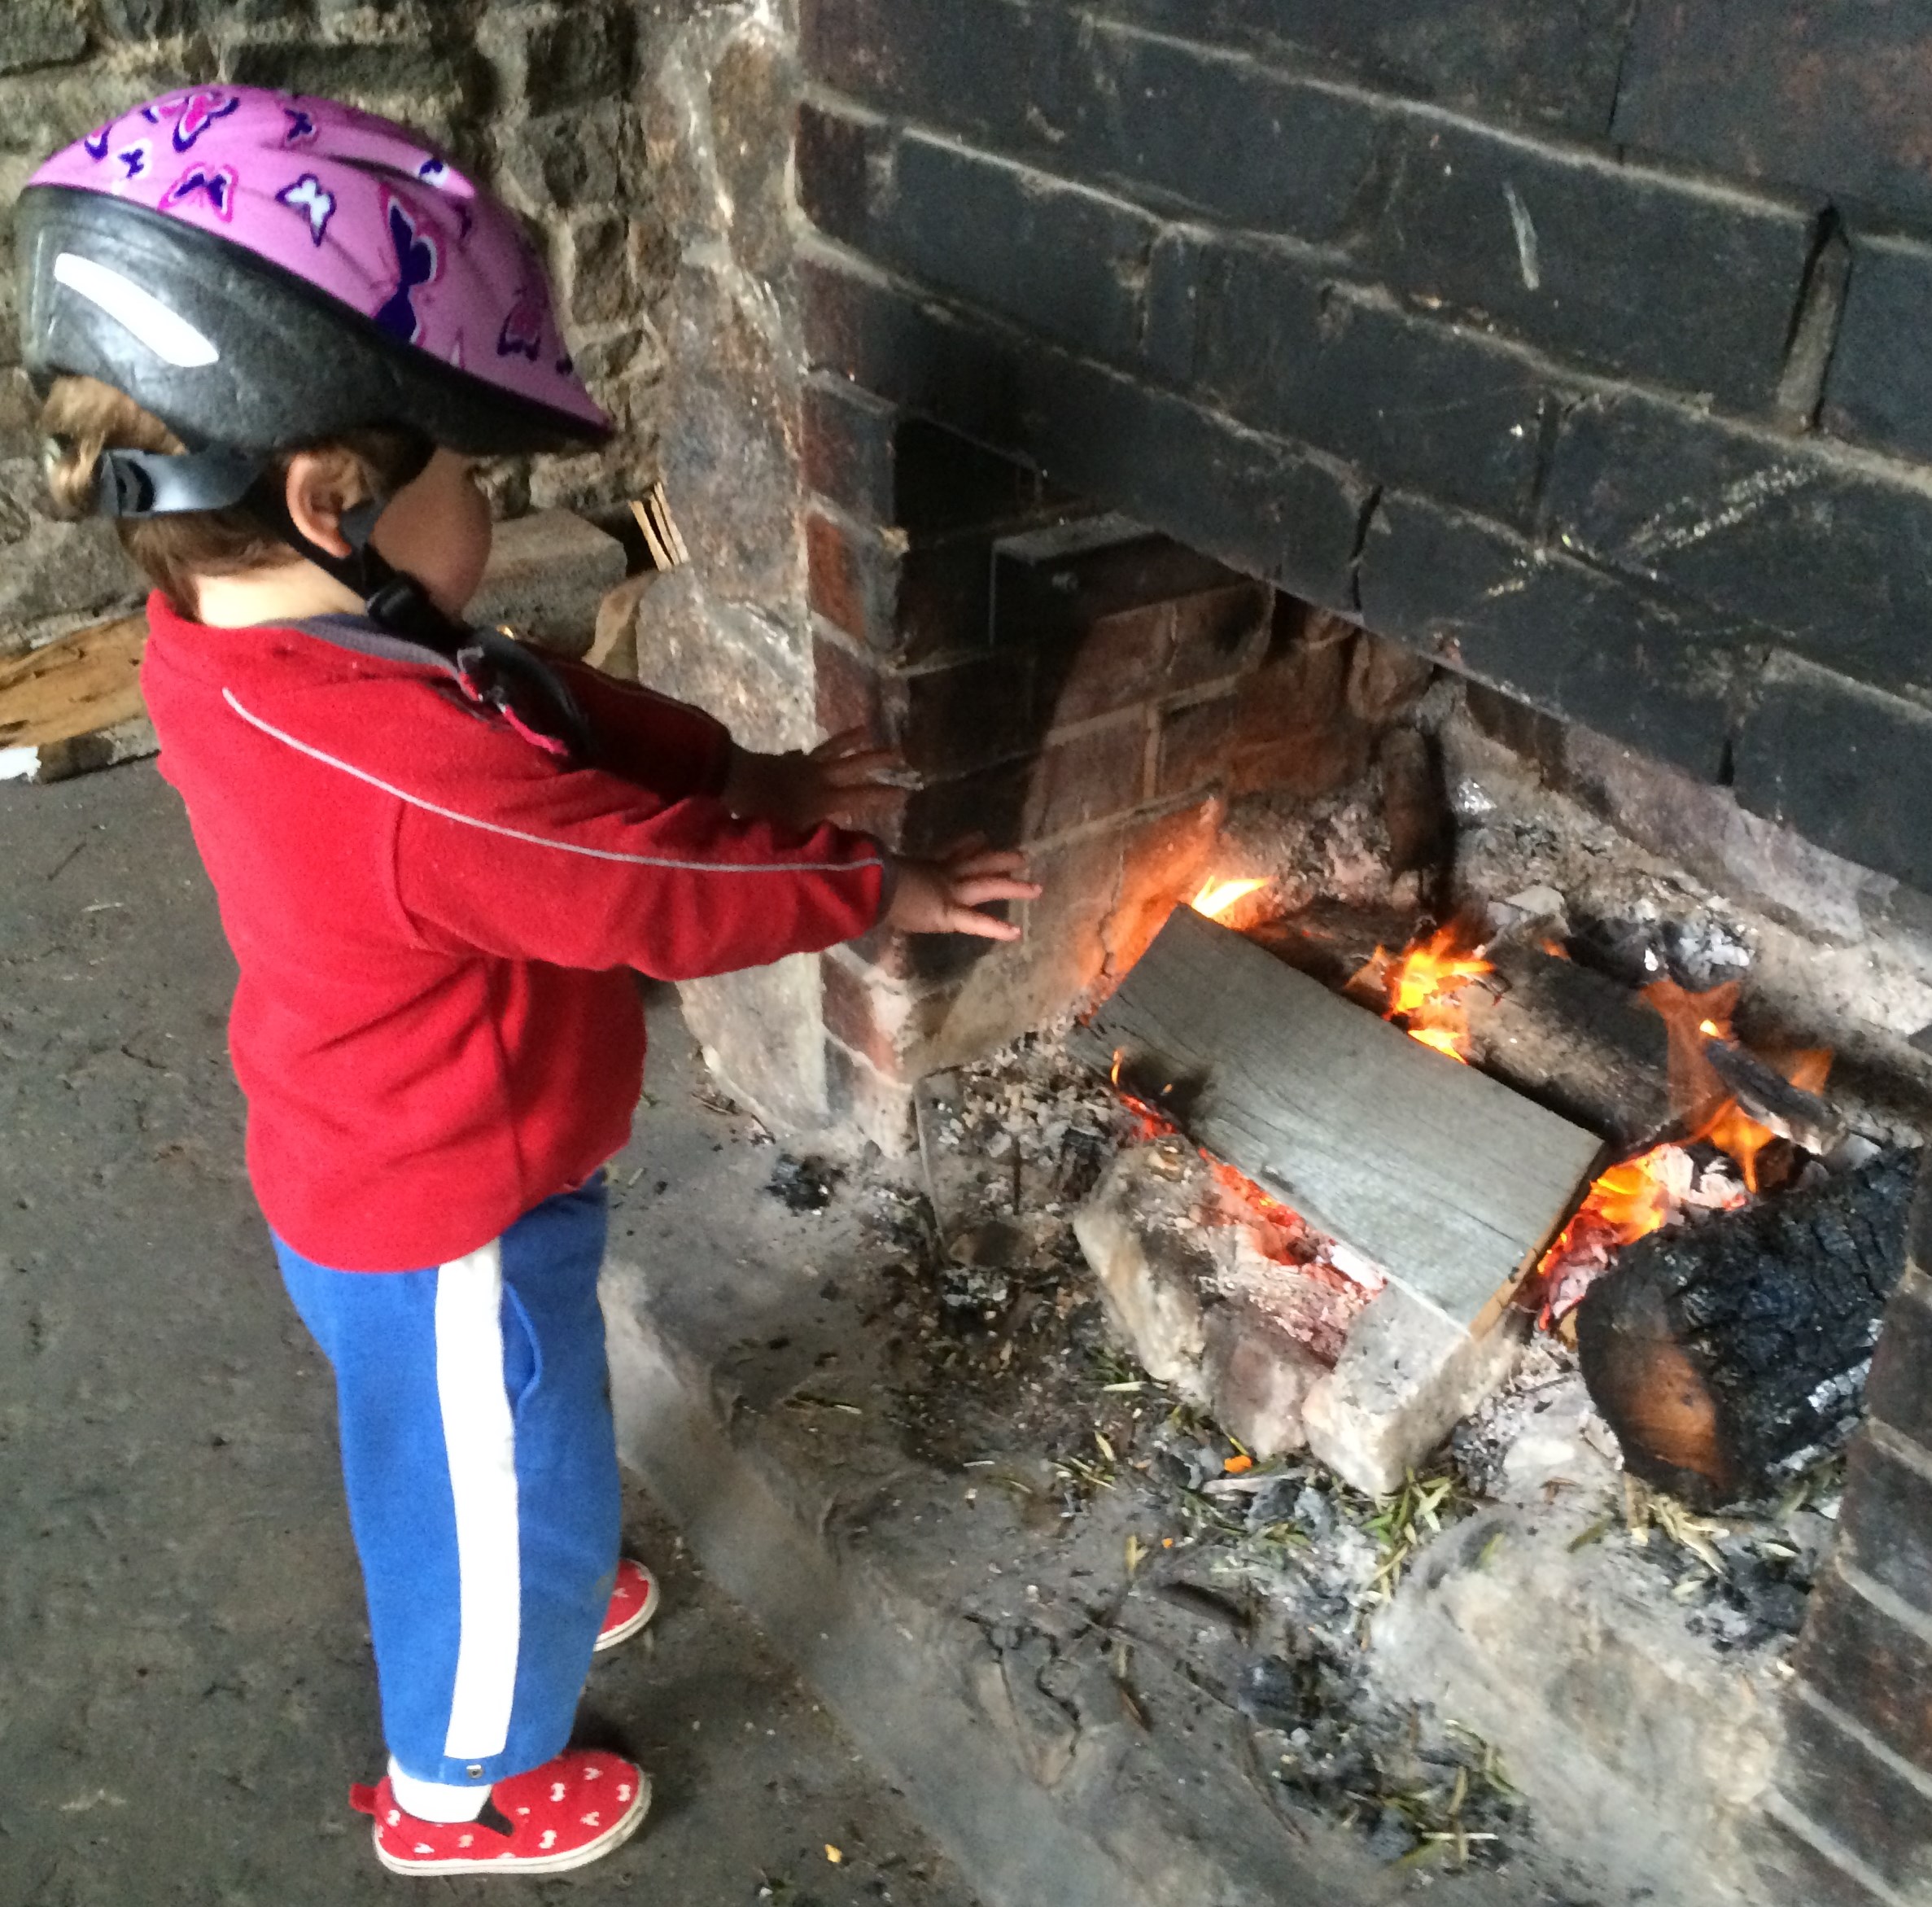
After a few minutes at The Chalet, we decided that it was getting too cold to go further up the mountain, and we rolled slowly back down. We stopped at The Springs to give the brakes a chance to cool, and explored the hut. Peter enjoyed the crackling log fire.

Warming hands at The Springs

We had a slow and safe descent, and arrived home just in time to go and collect the girls from school.

An Indoor Rock Climbing Session

My legs were very tired after this effort, but I had promised my eldest daughter that I’d take her rock climbing that evening. I had not been climbing for a long time. Hobart has a great rock climbing place, Rock It Climbing Centre, and so the two of us headed down that evening to get in some climbs.

No pictures of the evening. We had a good time but my body was ready to pack it in by the end! Four or five climbs each, some bouldering, and for my daughter, some tunneling. We mutually agreed that our muscles could take no more after an hour and a half, and we finished off the evening with a hot chocolate at the State Cinema cafe.

A great day. I was very sore on Saturday though!

Doing a Google aka closing down/handing over some stuff

As I am taking on some new challenges at work, I realised I needed to clear the decks a bit with my side projects. So with some sadness, I’ve decided to close down or hand over the following cycling-related projects and activities to other people.

mesmeride.com

mesmeride-2

Mesmeride was a holiday project I put together to teach myself Ruby on Rails. Mesmeride renders the elevation profile from a Strava ride in a variety of ways, imitating the Giro d’Italia profiles among others. I did want to put some more time into this, having ideas for maps and more flexible profiles, but it isn’t going to happen.

The Mesmeride website was at http://mesmeride.com/, on Twitter @mesmeride, and Facebook at https://facebook.com/mesmeride.

The site will shut down in a couple of weeks — time to get your graphics off or to tell me you want to take over running it (currently costing $9/month for the Heroku instance).

Source code for the site will remain at https://github.com/mcdurdin/mesmeride

The Hobart 10,000

The Hobart 10,000 is an annual ride over 3 days where a bunch of keen cyclists tackle 10,000 metres of climbing on some of Hobart’s iconic hills and mountains. Barry Jones and Mark Breen (@clunkersrule) are already doing a great job of running this event — I’m just handing over the digital reins.

The Hobart 10,000 can be followed on Facebook at https://facebook.com/hobart10000, on Twitter at @Hobart10000, and on the Strava club. The website http://hobart10000.com/ will be closing down.

@TassieCup

The TassieCup Twitter account reports on the progress of Tasmanian cyclists in the major pro races. I’ve handed control of the account over to the inimitable Daniel Wood (@danielwood1).


Hobart 10,000 Day 1, 2013 Report

8am at sea level we gathered, 11 riders in all.  The hills loomed above us, but we were not daunted.  Climb them we would, and nothing would stop us.  And when we had climbed them, we would descend to the depths of the valleys, and again we would ascend their lofty heights.

‘Twas a pleasant dream.  And yet we prevailed.  Eight and nine tenths of us completed the course, a 2600m extravaganza of climbing following a tortuous and tangled route around the foothills of Mount Wellington.  One tenth of a rider?  Well, Dan descended the mountain in the support vehicle.  But he did complete all the climbing that was on the menu.  The other Dan pled broken ribs in his early abandon.  And one other rider — his name now lost to my ken — pled afternoon criterium.

Our organisers had fled.  Barry had a touch of the man flu.  And Mark seemed to think it would be more fun to play with awesome slag-destroying remote control robots!

Mark's Slag Destroying Robot
Mark’s Slag Destroying Robot

But we knew we could make it on our own.

The full route, annotated

IMG_5641

The morning started with a warm up on Napoleon St.

Napoleon St, 100m @ 16.1%. So short Mesmeride has trouble drawing it!

Then Lynton Ave.

Lynton Ave, 200m @ 12.5%

And Washington St.

Washington St. 400m @ 11.7%. But what a finish!
Washington St
Washington St

Followed closely by Hillborough Rd.

Hillborough Rd, 700m @ 13.6%

Lots of steep climbs.  Even Sam was forced to swap into the little ring on some of those hills.  After Hillborough Dan farewelled us, as we made our way to Waterworks, and then huffed and puffed our way to the top.

Waterworks, 1200m @ 11.8%

IMG_9239

A welcome break was had there, as our intrepid and trusty support driver Stephen awaited with food and drink.  Made the day so much better!

Back down the hill.  A good sensible gradient this time, Huon Rd.

Huon Rd, 4.5km @ 6%

But back to the silly climbs with Old Farm Rd shortly thereafter!

Old Farm Rd, 1.8km @ 8.9%

That was the last of the crazy short steep climbs.  Now we just had 2 climbs left: Strickland and Longley – Wellington.

IMG_9293

Strickland we cruised, slightly quicker than I thought we would be able to.

Strickland, 3.0km @ 5.6%

But when we arrived at Longley, another rider noticed that I had broken a spoke on my rear wheel.  Yay!  A quick text message to our support driver, and he turned up within mere seconds, we had the wheel swapped out and ready to ride in moments.  So it seemed.

Longley Wheel Replacement

Up and up again!  Longley – Neika.  Neika – Fern Tree turnoff.

Neika, 5.6km @ 5.2%

And Fern Tree to the summit of Mt Wellington.  At this point, my legs were telling me ‘enough’!  I dropped back from the front group, and found a more comfortable pace with Chris, and we made our way to the top at a much more survivable pace.  Kudos to all the riders — Tim, Piers, Sam, and others — who finished with PRs up the final climb!

Mt Wellington, 11.2km @ 7.2%

IMG_9300

The weather was good, still but not hot.  Cloudy, just a fraction too cold on the descents, but not overly unpleasant.  The company was excellent!  Our support driver was great, and appreciated by all!

Sam did climb Wellington in the Big Ring. Kudos!

IMG_9340

And the hills?  Well, I was not quite defeated but I was surely sore at the end.  My Wellington time was certainly not impressive, and while my heart and lungs were ready to give, my legs were not! And the next morning I could barely move, groaning my way out of bed and around the house.  The forecast rain, sleet, hail and wind, together with my evident lack of form, were enough motive for me to pull out of day 2 🙁  I hope they had a good day!

Updated 5 Nov 2013: Photos added to the story. Full set of photos by our support driver Stephen are now available on Flickr

Introducing Mesmeride

So I recently had some holidays. Weird, I know. I took two whole weeks off and only had to go into the office twice during that time. My first week had unseasonably nice weather, so I spent some time on my bike making the most of it.

In the second week, the weather soured, so I took the opportunity to learn something of Ruby on Rails with the great Rails tutorial. I am not generally a big fan of tutorials but this particular one covered a lot of bases, and was well organised. Equally excellent were Railscasts.

After working through the first few chapters of the tutorial, I was comfortable enough to start on my own project to test my newly acquired knowledge.

Enter Mesmeride. With this project, I had two objectives:

  • Get a functional and “useful” Ruby on Rails site live in a week.
  • Get my Strava gradient rendering code running again with the new v3 Strava API.

mesmeride-1

Mesmeride allows you to take any Strava activity or segment, and graph it out in a number of different styles. You can add waypoints and control the length, height and size of the presentation, making it suitable for print or web. After tweaking the style of the graph to perfection, you can share the result on Twitter or Facebook, embed the image on your blog, or save it for printing or offline sharing.

Waypoints

Any ride of a reasonable length will have points of interest. The Giro renderer will draw these onto the profile. You can add and delete waypoints, move them along the ride, and change their names in the left hand box in the controls section.

Mountains or Molehills?

The most popular or remarked-upon feature is the ability to make any of your rides, even the most flat and featureless, look like a day attacking the biggest climbs of the Alps. You can control the mountainosity of your ride with the Netherlands-Switzerlands slider (also called the Molehills-Mountain slider).

Size and Length

To help you adjust the dimensions of the graphic, for print or for web, you can rescale the entire ride graphic with the “Teensy – Ginormous slider”, or make the ride appear longer or shorter with the “Shopping Trip – Grand Tour” slider.

Sharing

What good is a graphic without eyes to look at it? Mesmeride has tools to share any of the graphics you create on Twitter, Facebook or even by embedding them in your blog. Or of course you can save the image and download it. The images are stored on Amazon S3, and you can save up to 3 for any given route.

Sharing your ride
Sharing your ride

I even drew the logo myself. Can you tell?

mesmeride-2

Mesmeride will save the design you create as well, and you can come back later and change it round into many other styles.

mesmeride-3

In the future I may add mapping, additional gradient styles, and more controls and waypoint types to existing styles.

Here are a few examples from my race last weekend, via Strava. No, I didn’t do well, but never mind 😉 The screenshots above show the editor in action; what you see below are the resulting files.  I even fixed a bug in Mesmeride when preparing this…

Hell of the South
Hell of the South, full route profile, with the Mesmeride “Giro” Renderer. The waypoints are fully customisable!
Hell of the South Climb 1
The Gardiner’s Bay Climb at the start of Hell of the South. Presented with the Mesmeride “Le Tour” segment renderer
Hell of the South Kettering Climb
The climb out of Kettering, presented in the “Le Tour” rendering style. This is the climb I came unstuck on…
Nicholl's Rivulet Climb
The Nicholl’s Rivulet Climb, a lovely, smooth winding climb which I suffered greatly on. Off the back… 🙂

To finish with, the whole ride again, in another style.

HotS "Hobart 10,000 Banner" Style
HotS “Hobart 10,000 Banner” Style

Giro-Your-Strava now does Strava Routes as well

Update May 2014: As Strava’s ride pages have changed format significantly, Giro-Your-Strava no longer works. The good news is that Mesmeride does rides — but unfortunately not routes as yet.

After a comment from Mike on my previous Giro-Your-Strava post asking if the bookmarklet could support Strava’s new Routes feature, I took a few minutes over breakfast to spelunk and found it wouldn’t be too hard.

Firebug’s DOM explorer actually made the task much, much simpler. My approach was simply to look for Great Big Arrays Of Numbers. I soon found, amongst all the Google, jQuery, Modernizr, Optimizely and other objects, a pageView object, which contained a number of juicy functions, including pageView.chartContext().dataContext().elevationStream() and pageView.pageContext().routeSegments(), which gave me all the information I needed. The data structures for routes are somewhat different to those for rides, so I opted to massage the Great Big Arrays those functions returned into the same basic structure as the ride data already used by the bookmarklet, rather than touch the rendering code at all.

So… after that overly detailed introduction, here ’tis. I’ve updated the bookmarklet to draw Giro-style elevation profiles for Strava Routes as well as for Rides. And of course, Le Tour-style elevation profiles for segments still work, within individual ride pages.

Note: this still won’t work in IE10, as Github returns the wrong Content-Type for the Javascript and IE gets a little panicky about it, and, well, just use a different browser.

1. Install the bookmarklet.

Here’s the bookmarklet. Just drag it to your Bookmarks toolbar to install it:

Giro-Your-Strava

2. Load a favourite Strava Route and click the bookmark.

(It’s best to wait for the page to load completely before clicking the bookmark.)

Here’s one of my favourite Strava Routes — Hobart 10,000 Day 1:

H10K 2013 Day 1 - Strava Route 2013-09-05 08-26-54

After a few seconds the gradient graphic may refresh with the correct font — this takes a second or two to download.

That’s it! This new bookmarklet still works with rides (so delete the old one!)

The source is still all on GitHub.  Again, if you improve the code, or accidentally hurt yourself while reading it, please do share with a comment on this post.

And as DC Rainmaker says, thanks for reading!

Giro-Your-Strava updated to give Le Tour treatment to the climbs!

Update May 2014: As Strava’s ride pages have changed format significantly, Giro-Your-Strava no longer works. The good news is that Mesmeride does the same and more!

After the Strava API debacle, my little Tour Segment Gradient tool no longer works, which is sad.  I’d put together a number of other Strava API-based widgets, but this was the only one which was really at all popular.  Yesterday, DC Rainmaker himself mentioned (thank you Ray!) the Giro-Your-Strava elevation graph tool (which does still work) on his blog, so what better time to update the Tour Segment Gradient tool?

In short, what I have done is to dump both the Giro and Le Tour gradient mashups into the same bookmarklet.  One click and you get beautiful isometric graphs for your ride (in Giro style) and your efforts (in Le Tour style).  Yes, I get the inconsistency, but what would life be without idiosyncracies?

1. Install the bookmarklet.

Here’s the bookmarklet.  Just drag it to your Bookmarks toolbar to install it:

Giro-Your-Strava

2. Load a favourite Strava ride and click the bookmark.

(It’s best to wait for the page to load completely before clicking the bookmark.)

Presto, you’ll get two spiffy new buttons, one for your ride:

And one for the segment view:

So go ahead and click the Giro button, and you’ll see:

Click the Le Tour button for the new elevation profile for a segment:

Have fun!

One danger with bookmarklets that fiddle with an existing site in this way is that they will tend to break when the site updates.  There are no stability guarantees that APIs (ususally!) provide, so YMMV.  However, if the Strava site layout changes, it’s probably only a simple tweak to the code to get it working again.

There’s nothing beautiful about the code on the backend.  It really needs rewriting and modularisation etc etc etc but hey, it works 😉  Do what you want with the code, just share it with us all if you improve things!

Strava have decided to abandon their developer community

I received an email from Strava today which was very disappointing.

Hello Marc,

As of July 1, 2013, V1/V2 API endpoints have been retired. Libraries, sites, and applications using these endpoints will cease to work.

In previous blog updates, we’ve discussed status and access to V3 of our API.  As mentioned then, we had to make difficult decisions this year about where to invest time and resources – feature development or a full-fledged API program.  We have chosen to focus on feature development at this time and so access to V3 of our API is extremely limited.

Any developer who has been granted access to V3 of the API has been contacted. We will revisit our API program and applications from time to time, but for the time being, we have no plans to grant further access in 2013.

If you have questions or comments, please send an email to [email protected]. Given our limited resources, you should not expect an immediate response.

Thanks for your understanding,

Your Friends at Strava

The highlights (or lowlights) from this email:

  • Strava have no plans to allow anyone else to access their new API for at least six months
  • It seems Strava aren’t interested in dialogue with their community about this decision.

I’ve been using the Strava V1 and V2 APIs now for several years, and have written quite a few blog posts about how to use it.  The V1 and V2 APIs were always fairly experimental, but that was okay.  We all understood that and it was part of the fun of working with Strava.

Discontinuing the V1 and V2 APIs was in the pipeline, and again we Strava API users could understand limiting the V3 API beta program to a small number of developers.  However, the abrupt announcement today that not only are the V1 and V2 APIs no longer available, but now Strava won’t be making the V3 API available to anyone else for an Internet Eternity (that is, at least 6 months) either is completely unexpected.

The only Windows Phone app that integrates with Strava no longer works.  My apps no longer work.  And there appears to be no future for any of these apps.

Now, I’ve been a Strava Ambassador since before they started their official Ambassador program, and have had a lot of fun promoting Strava.  I’ve developed popular tools that integrate with the Strava API.  It is a very big disappointment to me that they’ve decided to throw away all that good-will with their developer community.  This is not the way to treat the most dedicated and enthusiastic portion of your user base, Strava!

Giro-style elevation graphs for Strava

Update May 2014: As Strava’s ride pages have changed format significantly, Giro-Your-Strava no longer works. The good news is that Mesmeride does the same and more!
Update 13 July 2013: An updated version of Giro-Your-Strava is now available here.

Just in time for the last few days of the Giro, I’ve finished a little after-hours Strava mashup project that builds on the segment graphs that I originally created for the Hobart 10,000.

I’m sure you’ve seen some of the Giro elevation graphs. Here’s one, from Stage 11:

Now, here’s a bookmarklet.  Drag it to your bookmarks toolbar, load up a favourite hilly ride on Strava, and click the bookmarklet.

Giro-Your-Strava

A mysterious new button will appear in the graph menu.  Go, on click it!

And up pops an elevation graph that makes it look like you’ve been riding the Giro!

The algorithm picks the categorised climbs from your ride (and tries to figure out the most appropriate segment where multiple segments finish at the top of a hill). Non-categorised segments are currently ignored.  The whole project is published on GitHub, so you can tweak it and improve it to your heart’s content.  Your first step should be to tidy up the mess I’ve left you 🙂

Plotting Pretty Elevation Profiles with the Strava API

Update 13 July 2013: After the deprecation of the Strava API, this tool no longer works. However, an updated version of this segment gradient tool is now available here.

So this tool plots elevation profiles from Strava data. OK, so maybe the profiles aren’t amazingly pretty.  But I had fun making them look somewhat like the elevation profiles from a certain famous cycling event!

Lipscome + Nicholas climb

This little hacked-together piece of JavaScript will plot the elevation from a Strava segment (in metric units only, of course!) and uses the familiar green-blue-red-black styling to represent the severity of the gradient.

I wrote the code to fulfill a specific purpose: generating graphs for the Hobart 10,000 ride.  But I figured I’d make the code and tool available for anyone to use or fiddle with as they see fit.

This tool requires IE9, Firefox, Safari, Chrome or any other canvas-aware browser.  If you plug in bad data, you’ll get bad results.  So don’t.  All the parameters dynamically refresh the profile, except for the segment ID field, after which you’ll need to click Load Segment.

If you want to play with the source yourself, the only thing you need to do server-side is plug in the data from: http://www.strava.com/api/v1/stream/segments/segmentid

Go knock yourself out here: http://hobart10000.com/segment-gradient.php

Updated 15 Aug 2012: The tool now does isometric projection, which I think looks quite a lot nicer, and I’ve tidied up the user interface and added a few more controls.  As noted by Jonathan in the comments, it doesn’t do too well with downhill segments — the tool assumes it is an uphill segment at present.