One of my favourite Windows tools is Procmon. I pull it out regularly, often as a first port of call when diagnosing complicated and opaque problems in the software I develop. Or in anyone’s software, really.
Procmon captures a trace of key I/O activities on your computer, including file, registry and network activity, and makes it really easy to spot operations that have failed or that may be causing problems. It’s great for spotting authentication problems, sharing violations, missing files and more (… malware). Procmon goes as far as recording a stack trace for nearly every operation it captures!
Today, we were trying to diagnose a problem with a process that was taking 15 seconds or longer to start on a Windows XP computer. The normal start time for that process should have been 1-2 seconds. None of the usual culprits came forward and admitted fault, so it was time to pull out Procmon again.
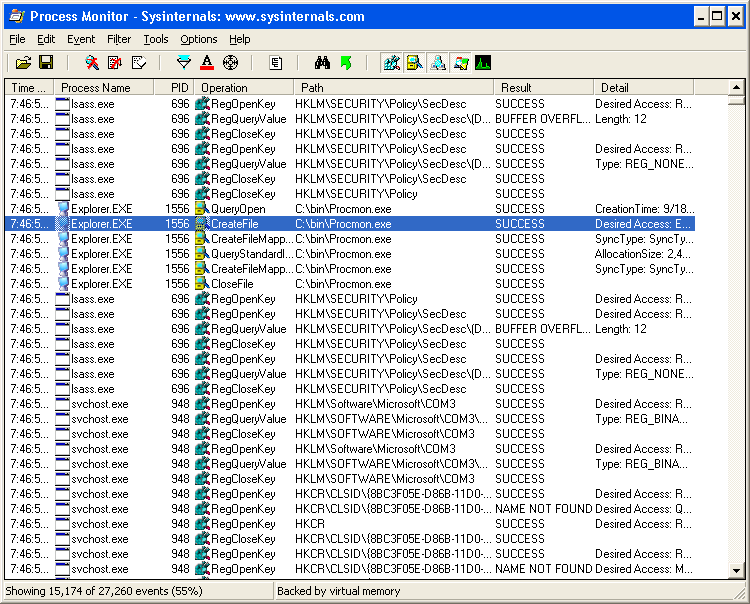
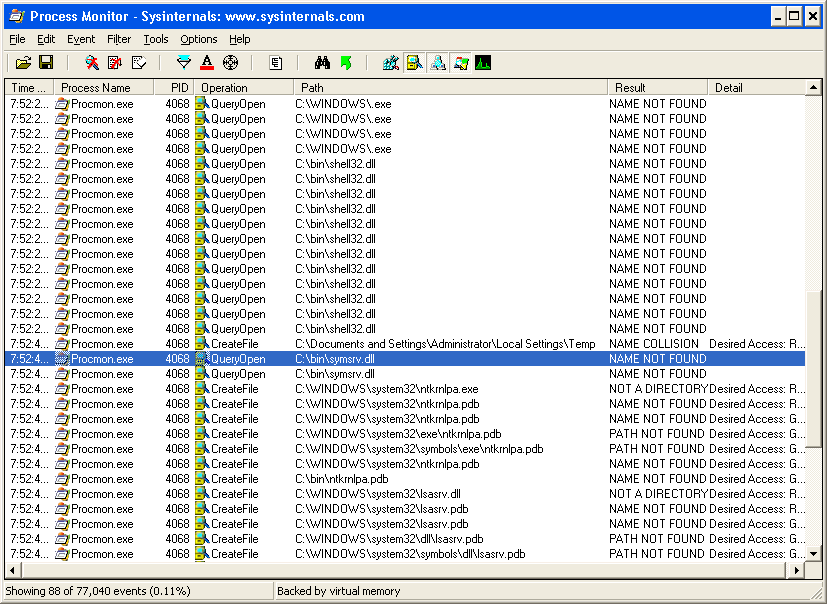
We quickly spotted a big fat delay in the trace. Note the time stamps in the two selected rows in the screen capture below.

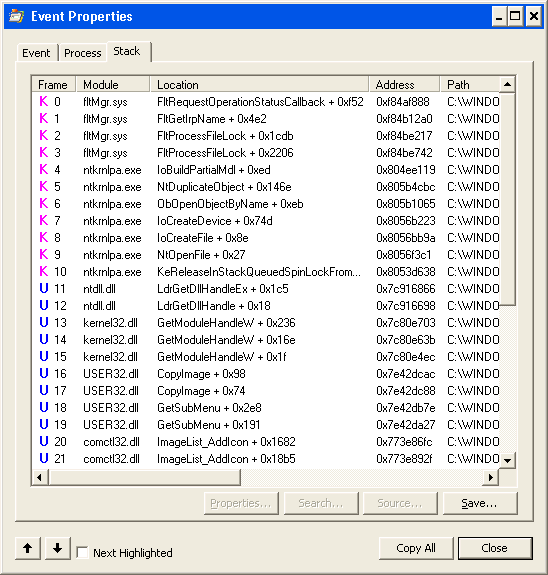
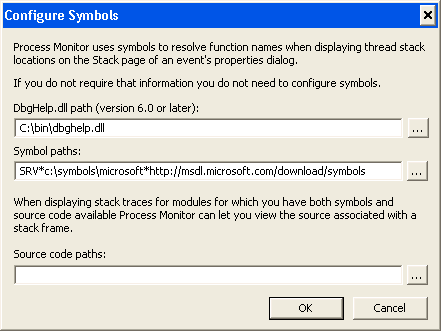
Now it was time to try and find out what was causing this. So we examined the stack trace for each entry, except … there were no symbols. Easy enough to fix — copy dbghelp.dll from a version of Microsoft’s Debugging Tools for Windows onto the system temporarily, fixup the symbol path in Procmon’s options, and … nope, still no symbols. Now this is one area where Procmon falls down a little bit. If symbol loading fails, it just silently fails. No warnings, errors or hints as to what might be going on.
This issue was occurring on a client’s computer, so it was time to take the investigation elsewhere for examination. Before we could really examine the captured trace, we needed to get symbols going. But how?
Procmon to the rescue!
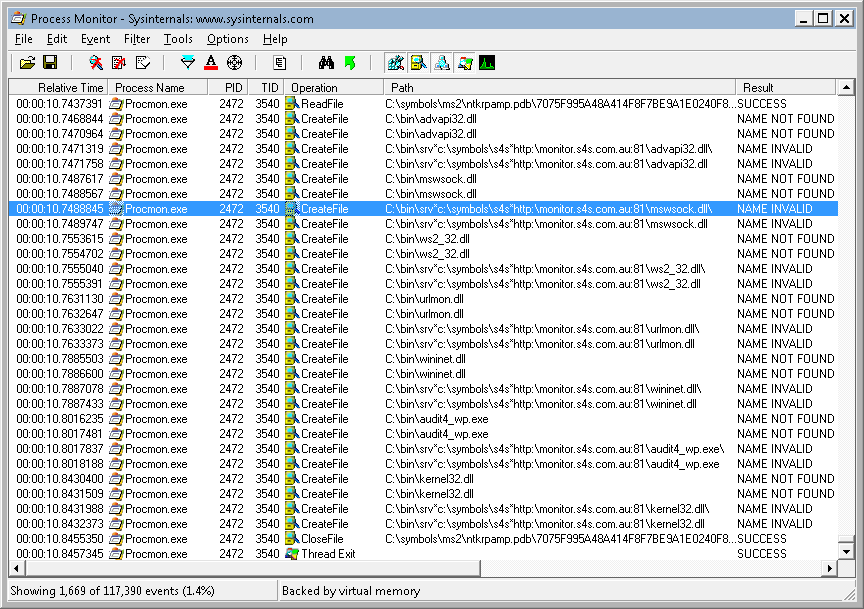
That’s right, we realised we can use Procmon to diagnose itself! I booted up a clean new Windows XP virtual machine, loaded Procmon onto it, ran a basic capture of some random events.
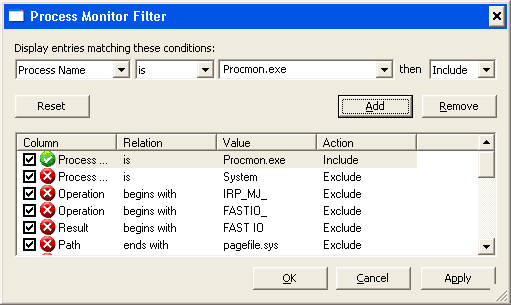
Even after configuring symbols, they still silently failed to load. So I stopped the capture, saved it and immediately opened the saved capture, to stop this instance of Procmon from capturing events on the local computer. I then started a second instance of Procmon, removed the Procmon exclusion from the filtering, and instead, added a filter to include Procmon (I also filtered specifically for the PID of the original Procmon, later):
Then I started the trace, switched back to the first Procmon, and tried to examine the stack. Of course, still no symbols, but now it was time to switch back to the second, active Procmon process and see what we found.
And what we found was that dbghelp.dll was looking for symsrv.dll in order to download its symbols. So we copied that also into the folder with procmon.exe and suddenly everything worked!
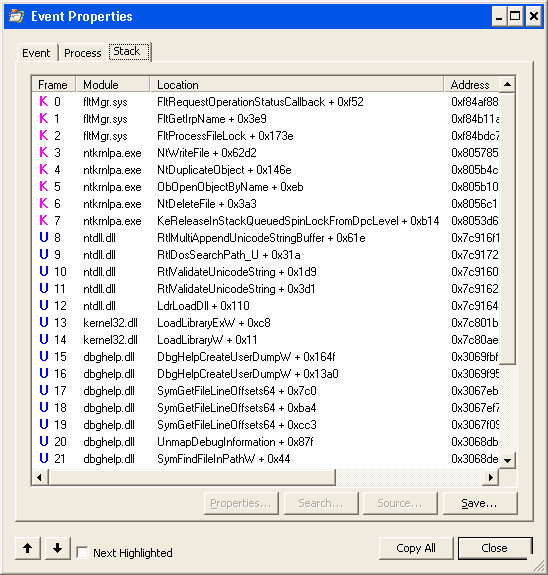
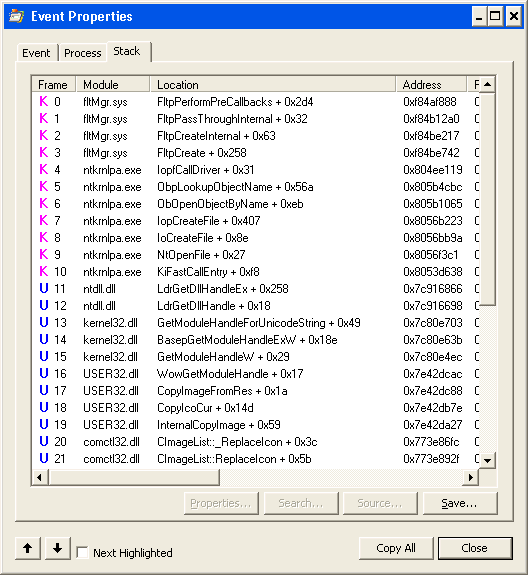
Update 19 Sep 2013: Oops. Forgot to attach the decorated stack (sorry!):
So that’s the first takeaway from this story: when you want symbols, copy both dbghelp.dll and symsrv.dll from your copy of Debugging Tools for Windows. We found no other dependencies, even with the latest version of these files.
A diversion
One curious anomaly we spotted: Procmon (or possibly Dbghelp) is looking in some strange places for debug symbols, including appending a SRV*path*url style symbol path to procmon’s parent path, and looking there, without much success:
I leave that one for you to solve.
Backtrack to the stack (trace)
Back to the original trace. We loaded up the saved trace, and found that we now got kernel mode symbols just fine, but no user mode symbols would load. In fact, Procmon doesn’t even appear to be looking for symbols for these user mode frames — either on the local drive or on the network. And this time Procmon isn’t able to give us any more detail. However, when we debugged the call that Procmon made to SymFindFileInPath when viewing a call stack in this log vs another new log, we found that Procmon wasn’t even providing the necessary identifying information.
What information is this? The identifying information that the symbol servers use is the TimeDateStamp and the SizeOfImage fields from the PE header of the executable file (slightly different for .pdb files).
I surmise that this identifying information is missing from our original trace because this trace was captured before we copied version 6.0 or later of dbghelp.dll onto the client’s computer — meaning that the version that Procmon used when capturing the trace did not record this identifying information.
Therefore, the second takeaway of the story is: always copy a recent version of dbghelp.dll and symsrv.dll into the folder with procmon.exe, before starting a trace. Even if you intend to analyze the trace later, you’ll find that without these, you won’t get full stack traces.
(Dear Microsoft, please can you consider including these in the Procmon and Procexp downloads, given that you now own Sysinternals? Saves a lot of hassle!)