This morning I rode to work early, leaving home before 5:30am. This meant it was still dark and the wallabies were still out clubbing. Hundreds of them. It was just like riding past a cinema when a movie finishes, with the happy cinema-goers (or in this case wallabies) crossing the road oblivious to traffic, easily stunned by bright lights.
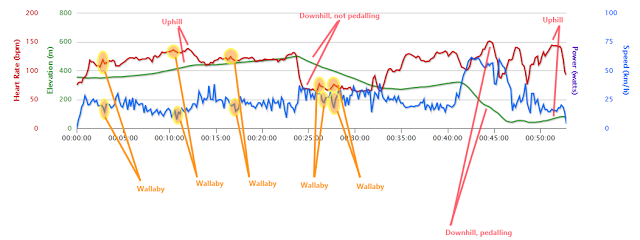
I would have seen at least 100 wallabies in the first half hour of the commute. Most of the wallabies were on the side of the road and I just watched them warily as I rode (slowly) past. But 5 wallabies decided to cross right in front of me. These wallaby interactions can be seen on the graph below.
Note the spike in heart rate coupled with the sudden drop in speed. One way of getting a cardio workout I guess. It really felt like a game of Frogger, albeit with a role reversal.

