Using WinDbg to debug Delphi processes can be both frustrating and rewarding. Frustrating, because even with the tools available to convert Delphi’s native .TDS symbol file format into .DBG or .PDB, we currently only get partial symbol information. But rewarding when you persist, because even though it may seem obscure and borderline irrational, once you get a handle on the way objects and Run Time Type Information (RTTI) are implemented with Delphi, you can accomplish a lot, quite easily.
For the post today, I’ve created a simple Delphi application which we will investigate in a couple of ways. If you want to follow along, you’ll need to build the application and convert the debug symbols generated by Delphi to .DBG format with map2dbg or tds2dbg. I’ll leave the finer details of that to you — it’s not very complicated. Actually, to save effort, I’ve uploaded both the source, and the debug symbols + dump + executable (24MB zip).
I’ve made reference to a few Delphi internal constants in this post. These are defined in System.pas, and I’m using the constants as defined for Delphi XE2. The values may be different in other versions of Delphi.
In the simple Delphi application, SpelunkSample, I will be debugging a simulated crash. You can choose to either attach WinDbg to the process while it is running, or to create a crash dump file using a tool such as procdump.exe and then working with the dump file. If you do choose to create a dump file, you should capture the full process memory dump, not just stack and thread information (use -ma flag with procdump.exe).
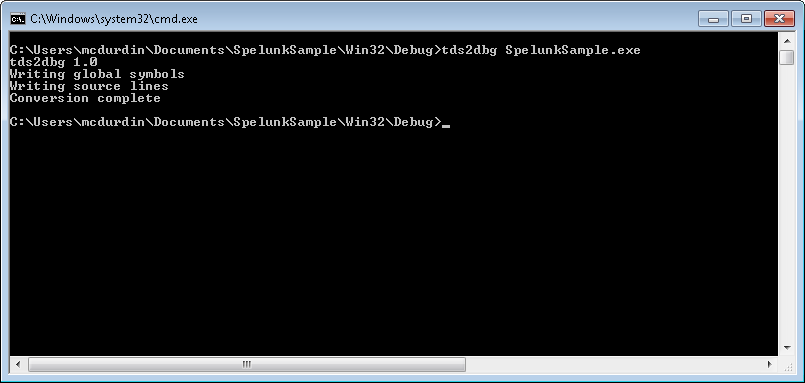
I’ll use procdump.exe. First, I use tds2dbg.exe to convert the symbols into a format that WinDbg groks:
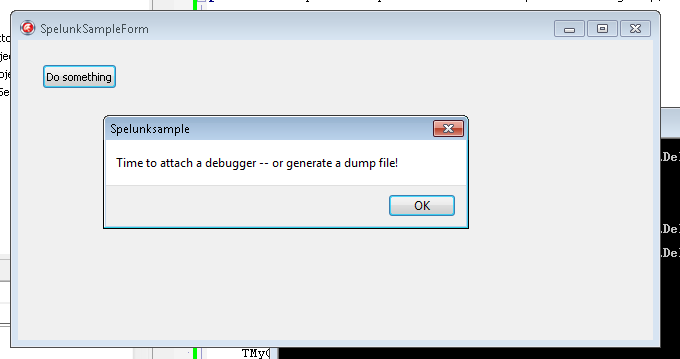
Then I just fire up the SpelunkSample process and click the “Do Something” button.
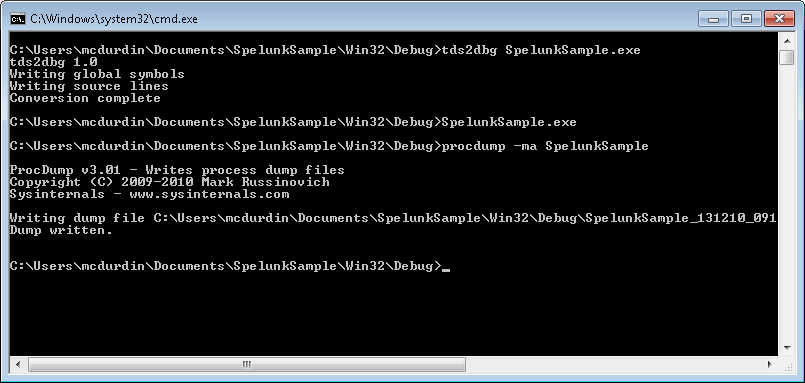
Next, I use procdump to capture a dump of the process as it stands. This generates a rather large file, given that this is not much more than a “Hello World” application, but don’t stress, we are not going to be reading the whole dump file in hex (only parts of it).
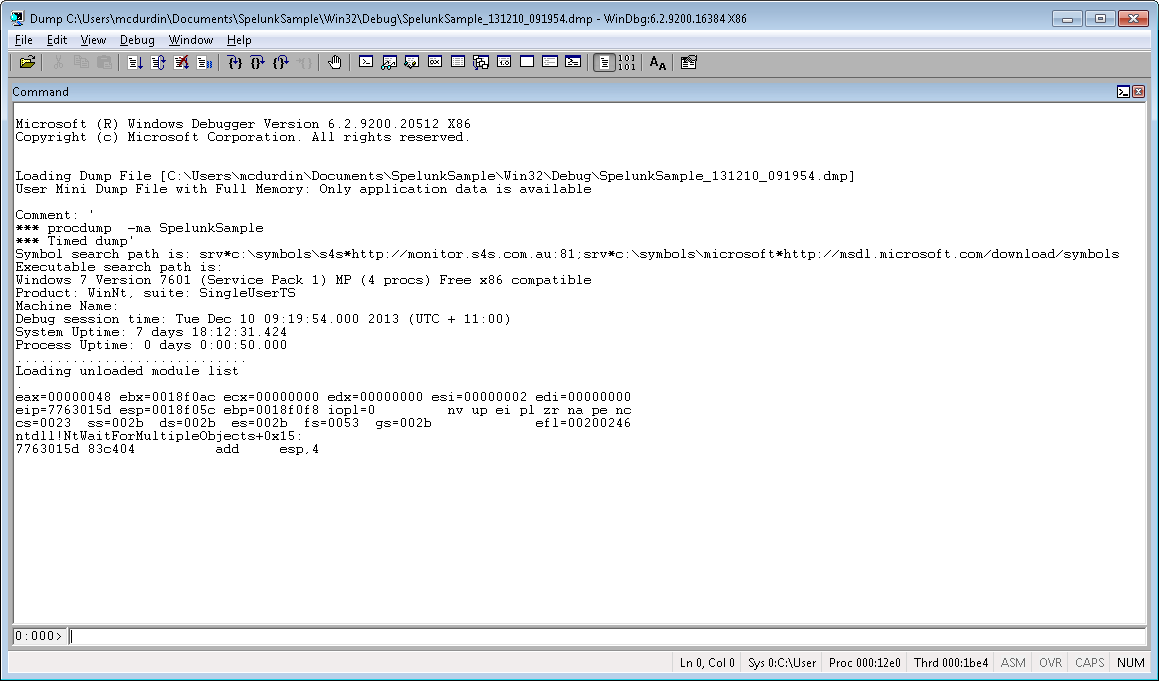
Time to load the dump file up in Windbg.
I want to understand what is going wrong with the process (actually, nothing is going wrong, but bear with me). I figure it’s important to know which forms are currently instantiated. This is conceptually easy enough to do: Delphi provides the TScreen class, which is instantiated as a global singleton accessible via the Screen variable in Vcl.Forms.pas. If we load this up, we can see a member variable FForms: TList, which contains references to all the forms “on the screen”.
TScreen = class(TComponent)
private
  FFonts: TStrings;
  FImes: TStrings;
  FDefaultIme: string;
  FDefaultKbLayout: HKL;
  FPixelsPerInch: Integer;
  FCursor: TCursor;
  FCursorCount: Integer;
  FForms: TList;
  FCustomForms: TList;
  ...
But how to find this object in a 60 megabyte dump file? In fact, there are two good methods: use Delphi’s RTTI and track back; and use the global screen variable and track forward. I’ll examine them both, because they both come in handy in different situations.
Finding objects using Delphi’s RTTI
Using Delphi’s Run Time Type Information (RTTI), we can find the name of the class in memory and then track back from that. This information is in the process image, which is mapped into memory at a specific address (by default, 00400000 for Delphi apps, although you can change this in Linker options). So let’s find out where this is mapped:
0:000> lmv m SpelunkSample
start    end        module name
00400000 00b27000   SpelunkSample   (deferred)
    Image path: C:\Users\mcdurdin\Documents\SpelunkSample\Win32\Debug\SpelunkSample.exe
    Image name: SpelunkSample.exe
    Timestamp:        Tue Dec 10 09:19:01 2013 (52A641D5)
    CheckSum:         0071B348
    ImageSize:        00727000
    File version:     1.0.0.0
    Product version:  1.0.0.0
    File flags:       0 (Mask 3F)
    File OS:          4 Unknown Win32
    File type:        1.0 App
    File date:        00000000.00000000
    Translations:     0409.04e4
    ProductVersion:   1.0.0.0
    FileVersion:      1.0.0.0
Now we can search this memory for a specific ASCII string, the class name TScreen. When searching through memory, it’s important to be aware that this is just raw memory. So false positives are not uncommon. If you are unlucky, then the data you are searching for could be repeated many times through the dump, making this task virtually impossible. In practice, however, I’ve found that this rarely happens.
With that in mind, let’s do using the s -a command:
0:000> s -a 0400000 00b27000 "TScreen" 004f8f81 54 53 63 72 65 65 6e 36-00 90 5b 50 00 06 43 72 TScreen6..[P..Cr 004f9302 54 53 63 72 65 65 6e e4-8b 4f 00 f8 06 44 00 02 TScreen..O...D.. 00a8e926 54 53 63 72 65 65 6e 40-24 62 63 74 72 24 71 71 TScreen@$bctr$qq 00a8ea80 54 53 63 72 65 65 6e 40-24 62 64 74 72 24 71 71 TScreen@$bdtr$qq 00a8ea9f 54 53 63 72 65 65 6e 40-47 65 74 48 65 69 67 68 TScreen@GetHeigh 00a8eac2 54 53 63 72 65 65 6e 40-47 65 74 57 69 64 74 68 TScreen@GetWidth 00a8eae4 54 53 63 72 65 65 6e 40-47 65 74 44 65 73 6b 74 TScreen@GetDeskt 00a8eb0b 54 53 63 72 65 65 6e 40-47 65 74 44 65 73 6b 74 TScreen@GetDeskt 00a8eb33 54 53 63 72 65 65 6e 40-47 65 74 44 65 73 6b 74 TScreen@GetDeskt 00a8eb5d 54 53 63 72 65 65 6e 40-47 65 74 44 65 73 6b 74 TScreen@GetDeskt 00a8eb86 54 53 63 72 65 65 6e 40-47 65 74 4d 6f 6e 69 74 TScreen@GetMonit00ada300 54 53 63 72 65 65 6e 40-43 6c 65 61 72 4d 6f 6e TScreen@ClearMon 00ada32b 54 53 63 72 65 65 6e 40-47 65 74 4d 6f 6e 69 74 TScreen@GetMonit 00ada354 54 53 63 72 65 65 6e 40-47 65 74 50 72 69 6d 61 TScreen@GetPrima
Whoa, that’s a lot of data. Looking at the results though, there are two distinct ranges of memory: 004F#### and 00A#####. Those in the 00A##### range are actually Delphi’s native debug symbols, mapped into memory. So I can ignore those. To keep myself sane, and make the debug console easier to review, I’ll rerun the search for a smaller range:
0:000> s -a 0400000 00a80000 "TScreen"
004f8f81  54 53 63 72 65 65 6e 36-00 90 5b 50 00 06 43 72  TScreen6..[P..Cr
004f9302  54 53 63 72 65 65 6e e4-8b 4f 00 f8 06 44 00 02  TScreen..O...D..
Now, these two references are close together, and I will tell you that the first one is the one we want. Generally speaking, the first one is in the class metadata, and the second one is not important today. Now that we have that "TScreen" string found in memory, we need to go back 1 byte. Why? Because "TScreen" is a Delphi ShortString, which is a string up to 255 bytes long, implemented as a length:byte followed by data (ANSI chars). And then we search for a pointer to that memory location with the s -d command:
0:000> s -d 0400000 00a80000 004f8f80
004f8bac  004f8f80 000000bc 0043ff28 00404ff4  ..O.....(.C..O@.
Only one reference, nearby in memory, which is expected — the class metadata is generally stored nearby the class implementation. Now this is where it gets a little brain-bending. This pointer is stored in Delphi’s class metadata, as I said. But most this metadata is actually stored in memory before the class itself. Looking at System.pas, in Delphi XE2 we have the following metadata for x86:
  vmtSelfPtr           = -88;
  vmtIntfTable         = -84;
  vmtAutoTable         = -80;
  vmtInitTable         = -76;
  vmtTypeInfo          = -72;
  vmtFieldTable        = -68;
  vmtMethodTable       = -64;
  vmtDynamicTable      = -60;
  vmtClassName         = -56;
  vmtInstanceSize      = -52;
  vmtParent            = -48;
  vmtEquals            = -44 deprecated 'Use VMTOFFSET in asm code';
  vmtGetHashCode       = -40 deprecated 'Use VMTOFFSET in asm code';
  vmtToString          = -36 deprecated 'Use VMTOFFSET in asm code';
  vmtSafeCallException = -32 deprecated 'Use VMTOFFSET in asm code';
  vmtAfterConstruction = -28 deprecated 'Use VMTOFFSET in asm code';
  vmtBeforeDestruction = -24 deprecated 'Use VMTOFFSET in asm code';
  vmtDispatch          = -20 deprecated 'Use VMTOFFSET in asm code';
  vmtDefaultHandler    = -16 deprecated 'Use VMTOFFSET in asm code';
  vmtNewInstance       = -12 deprecated 'Use VMTOFFSET in asm code';
  vmtFreeInstance      = -8 deprecated 'Use VMTOFFSET in asm code';
  vmtDestroy           = -4 deprecated 'Use VMTOFFSET in asm code';
Ignore that deprecated noise — it’s the constants that we want to know about. So the vmtClassName is at offset -56 (-38 hex). In other words, to find the class itself, we need to look 56 bytes ahead of the address of that pointer that we just found. That is, 004f8bac + 38h = 004f8be4. Now, if I use the dds (display words and symbols) command, we can see pointers to the implementation of each of the class’s member functions:
0:000> dds 004f8bac + 38
004f8be4  00445574 SpelunkSample!System.Classes.TPersistent.AssignTo
004f8be8  004515f8 SpelunkSample!System.Classes.TComponent.DefineProperties
004f8bec  004454a4 SpelunkSample!System.Classes.TPersistent.Assign
004f8bf0  004516f0 SpelunkSample!System.Classes.TComponent.Loaded
004f8bf4  00451598 SpelunkSample!System.Classes.TComponent.Notification
004f8bf8  00451700 SpelunkSample!System.Classes.TComponent.ReadState
004f8bfc  004520ac SpelunkSample!System.Classes.TComponent.CanObserve
004f8c00  004520b0 SpelunkSample!System.Classes.TComponent.ObserverAdded
004f8c04  00451f24 SpelunkSample!System.Classes.TComponent.GetObservers
004f8c08  00451b48 SpelunkSample!System.Classes.TComponent.SetName
004f8c0c  00452194 SpelunkSample!System.Classes.TComponent.UpdateRegistry
004f8c10  00451710 SpelunkSample!System.Classes.TComponent.ValidateRename
004f8c14  00451708 SpelunkSample!System.Classes.TComponent.WriteState
004f8c18  0045219c SpelunkSample!System.Classes.TComponent.QueryInterface
004f8c1c  00505b90 SpelunkSample!Vcl.Forms.TScreen.Create
004f8c20  00452070 SpelunkSample!System.Classes.TComponent.UpdateAction
004f8c24  0000000e
004f8c28  00010000
004f8c2c  12880000
004f8c30  00400040 SpelunkSample+0x40
004f8c34  00000000
004f8c38  00000000
004f8c3c  1800001d
004f8c40  3800439d
004f8c44  06000000
004f8c48  6e6f4646
004f8c4c  00027374
004f8c50  439d1800
004f8c54  00003c00
004f8c58  49460500
004f8c5c  0273656d
004f8c60  12880000
Huh. That’s interesting, but it’s a sidetrack; we can see TScreen.Create which suggests we are looking at the right thing. There’s a whole lot more buried in there but it’s not for this post. Let’s go back to where we were.
How do we take that class address and find instances of the class? I’m sure you can see where we are going. But here’s where things change slightly: we are looking in allocated memory now, not just the process image. So our search has to broaden. Rather than go into the complexities of memory allocation, I’m going to go brute force and look across a much larger range of memory, using the L? search parameter (which allows us to search more than 256MB of data at once):
0:000> s -d 00400000 L?F000000 004f8be4
004f8b8c  004f8be4 00000000 00000000 004f8c24  ..O.........$.O.
0247b370  004f8be4 00000000 00000000 00000000  ..O.............
Only two references. Why two and not one, given that we know that TScreen is a singleton? Well, because Delphi helpfully defines a vmtSelf metadata member, at offset -88 (and if we do the math, we see that 004f8be4 - 004f8b8c = 58h = 88d). So let’s look at the second one. That’s our TScreen instance in memory.
In this case, there was only one instance. But you can sometimes pickup objects that have been freed but where the memory has not been reused. There’s no hard and fast way (that I am aware of) of identifying these cases — but using the second method of finding a Delphi object, described below, can help to differentiate.
I’ll come back to how we use this object memory shortly. But first, here’s another way of getting to the same address.
Finding a Delphi object by variable or reference
As we don’t have full debug symbol information at this time, it can be difficult to find variables in memory. For global variables, however, we know that the location is fixed at compile time, and so we can use the disassembler in WinDbg to locate the address relatively simply. First, look in the source for a reference to the Screen global variable. I’ve found it in the FindGlobalComponent function (ironically, that function is doing programatically what we are doing via the long and labourious manual method):
function FindGlobalComponent(const Name: string): TComponent;
var
  I: Integer;
begin
  for I := 0 to Screen.FormCount - 1 do
  begin
    ...
So, disassemble the first few lines of the function. Depending on the conversion tool you used, the symbol format may vary (x spelunksample!*substring* can help in finding symbols).
0:000> u SpelunkSample!Vcl.Forms.FindGlobalComponent
SpelunkSample!Vcl.Forms.FindGlobalComponent:
004fcda8 53              push    ebx
004fcda9 56              push    esi
004fcdaa 57              push    edi
004fcdab 55              push    ebp
004fcdac 8be8            mov     ebp,eax
004fcdae a100435200      mov     eax,dword ptr [SpelunkSample!Spelunksample.initialization+0xb1ac (00524300)]
004fcdb3 e81c910000      call    SpelunkSample!Vcl.Forms.TScreen.GetFormCount (00505ed4)
004fcdb8 8bf0            mov     esi,eax
The highlighted address there corresponds to the Screen variable. The initialization+0xb1ac rubbish suggests missing symbol information, because (a) it doesn’t make much sense to be pointing to the “initialization” code, and (b) the offset is so large. And in fact, that is the case, we don’t have symbols for global variables at this time (one day).
But because we know this, we also know that 00524300 is the address of the Screen variable. The variable, which is a pointer, not the object itself! But because it’s a pointer, it’s easy to get to what it’s pointing to!
0:000> dd 00524300 L1
00524300  0247b370
Look familiar? Yep, it’s the same address as we found the RTTI way, and somewhat more quickly too. But now on to finding the list of forms!
Examining object members
Let’s dump that TScreen instance out and annotate its members. The symbols below I’ve manually added to the data, by looking at the implementation of TComponent and TScreen. I’ve also deleted some misleading annotations that Windbg added.
0:000> dds poi(00524300)
0247b370  004f8be4 TScreen
0247b374  00000000 TComponent.FOwner
0247b378  00000000 TComponent.FName
0247b37c  00000000 TComponent.FTag
0247b380  00000000 TComponent.FComponents
0247b384  00000000 TComponent.FFreeNotifies
0247b388  00000000 TComponent.FDesignInfo
0247b38c  00000000 TComponent.FComponentState
0247b390  00000000 TComponent.FVCLComObject
0247b394  00000000 TComponent.FObservers
0247b398  00000001 TComponent.FComponentStyle
0247b39c  00000000 TComponent.FSortedComponents
0247b3a0  0043fec8
0247b3a4  0043fed8
0247b3a8  00000000 TScreen.FFonts
0247b3ac  024b4e10 TScreen.FImes
0247b3b0  00000000 TScreen.FDefaultIme
0247b3b4  04090c09 TScreen.FDefaultKbLayout
0247b3b8  00000060 TScreen.FPixelsPerInch
0247b3bc  00000000 TScreen.FCursor
0247b3c0  00000000 TScreen.FCursorCount
0247b3c4  02489da8 TScreen.FForms
0247b3c8  02489dc0 ...
How did I map that? It’s not that hard — just look at the class definitions in the Delphi source. You do need to watch out for two things: packing, and padding. x86 processors expect variables to be aligned on a boundary of their size, so a 4 byte DWORD will be aligned on a 4 byte boundary. Conversely, a boolean only takes a byte of memory, and multiple booleans can be packed into a single DWORD. Delphi does not do any ‘intelligent’ reordering of object members (which makes life a lot simpler), so this means we can just map pretty much one-to-one. The TComponent object has the following member variables (TPersistent and TObject don’t have any member variables):
  TComponent = class(TPersistent, IInterface, IInterfaceComponentReference)
  private
    FOwner: TComponent;
    FName: TComponentName;
    FTag: NativeInt;
    FComponents: TList;
    FFreeNotifies: TList;
    FDesignInfo: Longint;
    FComponentState: TComponentState;
    FVCLComObject: Pointer;
    FObservers: TObservers;
    ...
    FComponentStyle: TComponentStyle;
    ...
    FSortedComponents: TList;
And TScreen has the following (we’re only interested in the members up to and including FForms):
  TScreen = class(TComponent)
  private
    FFonts: TStrings;
    FImes: TStrings;
    FDefaultIme: string;
    FDefaultKbLayout: HKL;
    FPixelsPerInch: Integer;
    FCursor: TCursor;
    FCursorCount: Integer;
    FForms: TList;
    ...
Let’s look at 02489da8, the FForms TList object. The first member variable of TList is FList: TPointerList. Knowing what we do about the object structure, we can:
0:000>dd 02489da8 L4
02489da8  004369e8 02482da8 00000001 00000004
It can be helpful to do a sanity check here and make sure that we haven’t gone down the wrong rabbit hole. Let’s check that this is actually a TList (poi deferences a pointer, but you should be able to figure the rest out given the discussion above):
0:000> da poi(004369e8-38)+1
00436b19  "TList'"
And yes, it is a TList, so we haven’t dereferenced the wrong pointer. All too easy to do in the dark cave that is assembly-language debugging. Back to the lead. We can see from the definition of TList:
  TList = class(TObject)
  private
    FList: TPointerList;
    FCount: Integer;
    FCapacity: Integer;
    ...
That we have a pointer to 02482da8 which is our list of form pointers, and a count of 00000001 form. Sounds good. Take a quick peek at that form:
0:000> dd poi(02482da8) L1
02444320  005112b4
0:000> da poi(poi(poi(02482da8))-38)+1
0051148e  "TSpelunkSampleForm."
Yes, it’s our form! But what is with that poi poi poi? Well, I could have dug down each layer one step at a time, but this is a shortcut, in one swell foop dereferencing the variable, first to the object, then dereferencing to the class, then back 38h bytes and dereferencing to the class name, and plus one byte for that ShortString hiccup. Saves time, and once familiar you can turn it into a WinDbg macro. But it’s helpful to be familiar with the structure first!
Your challenge
Your challenge now is to list each of the TMyObject instances currently allocated. I’ve added a little spice: one of them has been freed but some of the data may still be in the dump. So you may find it is not enough to just use RTTI to find the data — recall that the search may find false positives and freed instances. You should find that searching for RTTI and also disassembling functions that refer to member variables in the form are useful. Good luck!
Hint: If you are struggling to find member variable offsets to find the list, the following three lines of code from FormCreate may help (edx ends up pointing to the form instance):
0051168f e87438efff      call    SpelunkSample!System.TObject.Create (00404f08)
00511694 8b55fc          mov     edx,dword ptr [ebp-4]
00511697 898294030000    mov     dword ptr [edx+394h],eax