The other day, I was running a routine Process Monitor (Procmon) trace to debug an issue in Keyman, when I noticed something strange: over 50% of the events displayed with the default filter (which excludes a lot of system-level noise and procmon-related feedback) were coming from a single process: services.exe.
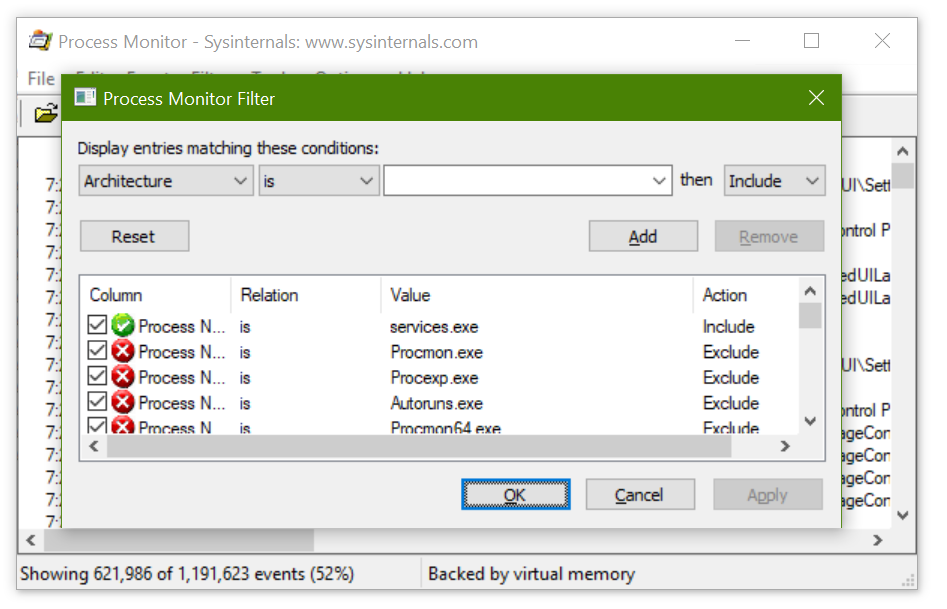
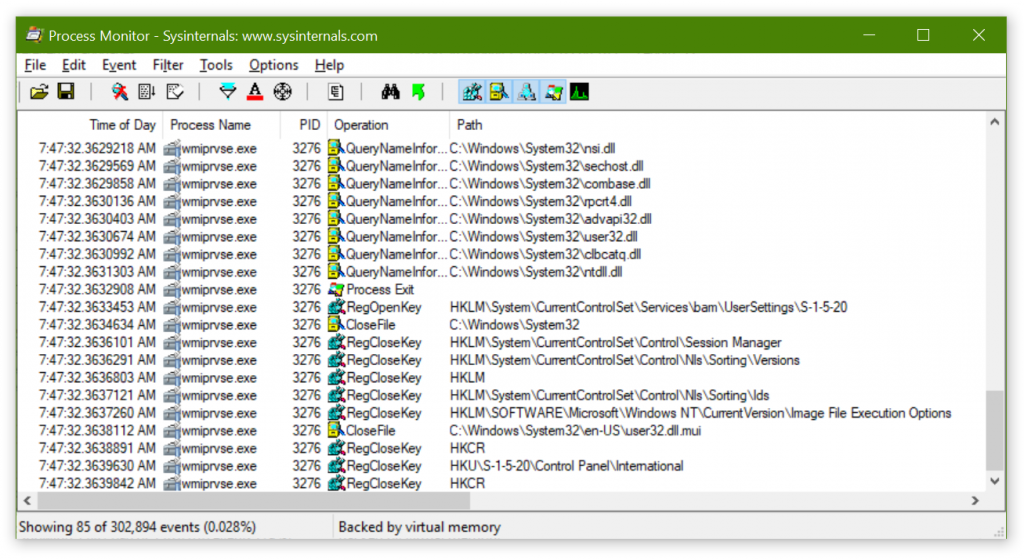
You can see in the image below I’ve added services.exe to the filter (Process Name is services.exe), and then the status bar shows 52% of events belonging to it.
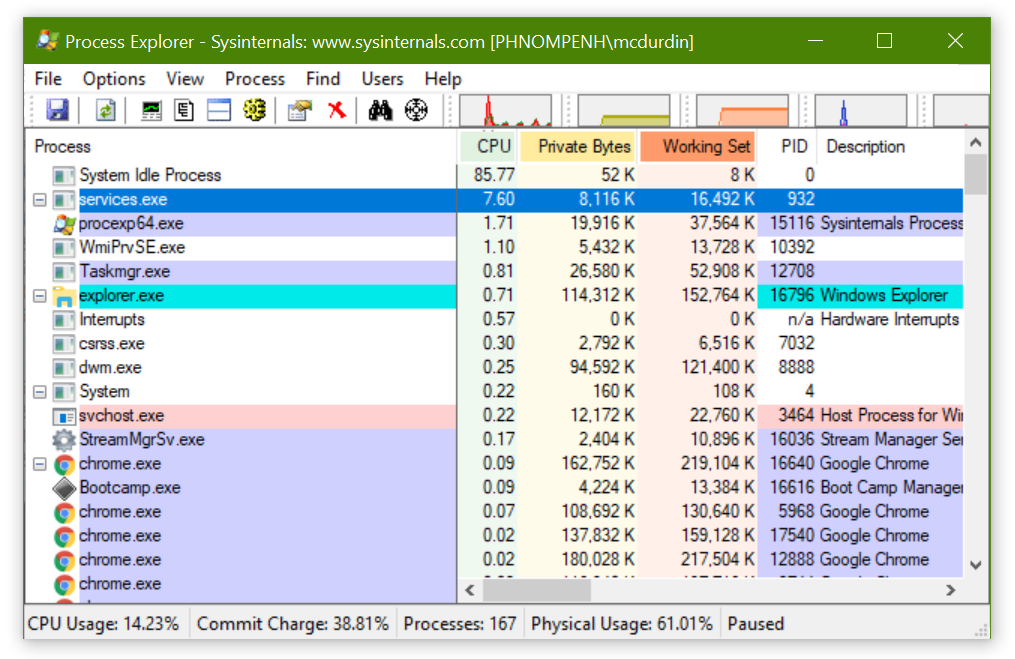
Puzzled, I set aside some time to dig a little further (which means I went to bed late one evening). Watching Process Explorer, I could see that services.exe and wmiprvse.exe were between them consuming about 10% of my CPU. This did not seem normal. Nor did it seem to be a good thing for my battery life.
Deciding to examine the trace a little, I filtered out common registry keys and events, such as RegCloseKey, which made it easier to spot a pattern. It became obvious that every 5 seconds, services.exe, with the help of wmiprvse.exe, would enumerate the list of services from the registry, sending about 120,000 events to the Procmon trace in the process. Nearly 80% of the events captured each minute by Procmon were generated by either services.exe or wmiprvse.exe!
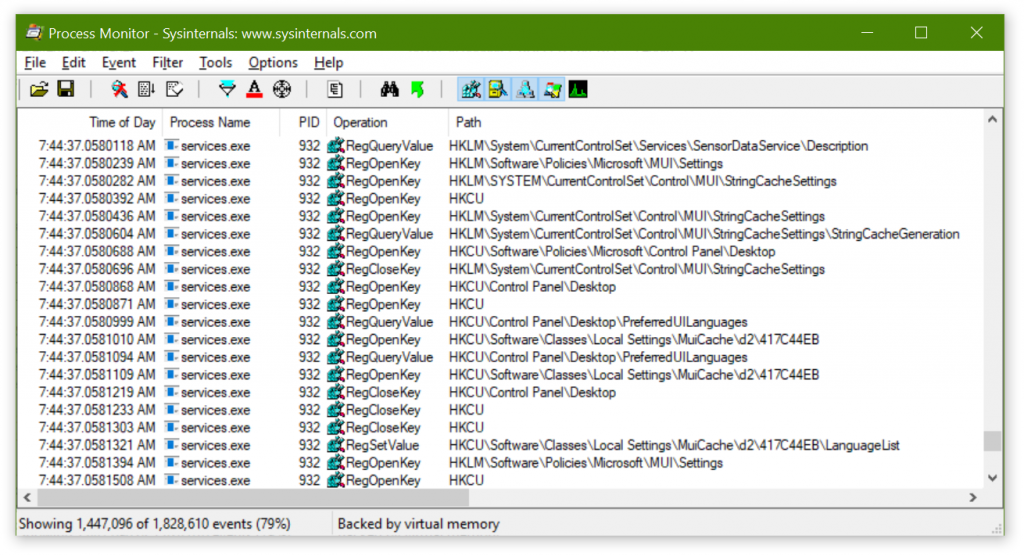
Nearly 80% of the events captured each minute by Procmon were generated by either services.exe or wmiprvse.exe!
Given that wmiprvse.exe, the Windows Management Instrumentation (WMI) provider host, was involved, it seemed likely that there was a process issuing WMI queries against the Services provider, such as you can do with PowerShell:
Get-WmiObject Win32_Service | Format-Table Name, DisplayName, State, StartMode, StartName
It was just a matter of figuring out which one.
I started off by trying to dig into WMI logging. I don’t know if you’ve ever dug into that, but it’s huge, complex and somewhat impenetrable. It is likely that with the right knowledge I could have issued a command that gave me a list of queries being issued and who was issuing them. But I have not yet acquired that knowledge, sadly, and late at night my brain did not feel up to the attempt.
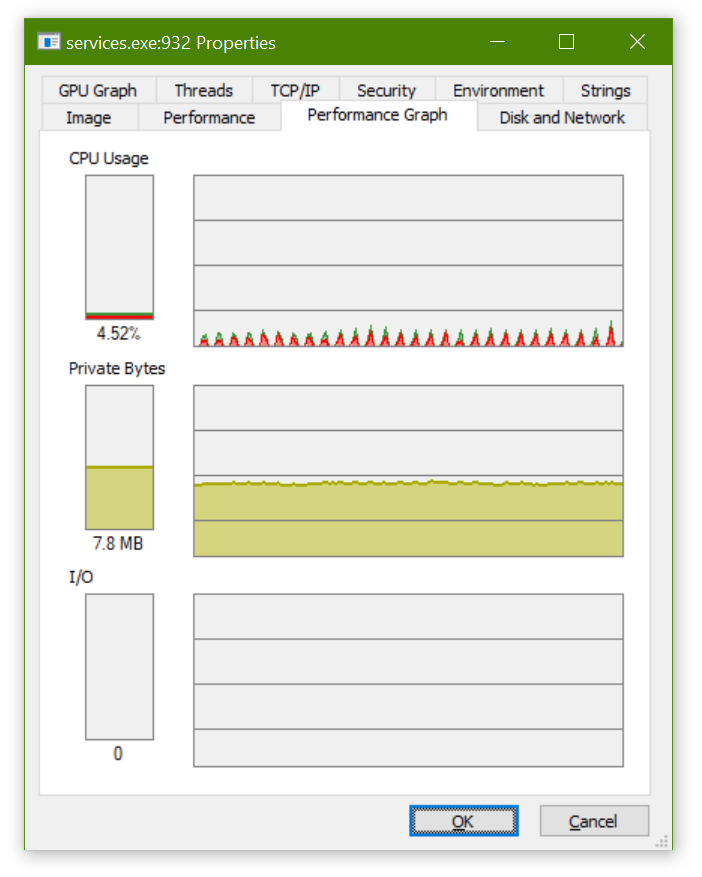
It seemed easier to instead to use a process of elimination of processes (yeah, I did that on purpose). I started the CPU monitor in Process Explorer for the services.exe process, which showed lovely 5 second spikes.
Then I started to stop various services, watching to see if the spiking stopped. It didn’t. Once I was down to a handful of critical services (do I really need to run the Firewall service?) I started looking at background user-level processes, such as the icons sitting in the System Notification Area.
And here I hit gold. After shutting down a few, including my own programs, with no noticeable change, I shutdown MySQL Notifier 1.1.7.

All of a sudden, CPU activity dropped to zero on the services.exe process, and the next Procmon trace showed a mere 85 events in a minute for the services.exe and wmiprvse.exe pair.
Success!
I checked the MySQL Notifier forums and saw no discussion of this issue, but I found a closed bug report in the bug database. I’ll have to add my comment to the bug report.
Once again, Procmon comes to the rescue 🙂 I’m looking forward to the increased battery life already!
I know it’s not the most elegant way to debug a problem, but sometimes it is quicker and easier than the alternatives. It’s especially easy to use process of elimination like this late at night, without having to think hard about it. 😉
Hi Marc,
Yup, see the same spikes on my Win 10 desktop machine, though only taking about 1% of CPU. Win 10’s inbuilt Resource Monitor actually allows much the same diagnostic facilities as ProcMon, and when the mysql services were stopped, sure enough, the spiking disappeared. Cheers!
Glad the blog was helpful! Do I know you from somewhere? 🙂