Category Archives: Windows

Debugging a stalled Delphi process with Windbg and memory searches

Today I’ve got a process on my machine that is supposed to be exiting, but it has hung. Let’s load it up in Windbg and find what’s up. The program in question was built in Delphi XE2, and symbols were generated by our internal tds2dbg tool (but there are other tools online which create similar .dbg files). As usual, I am writing this up for my own benefit as much as anyone else’s, but if I put it on my blog, it forces me to put in enough detail that even I can understand it when I come back to it!

Looking at the main thread, we can see unit finalizations are currently being called, but the specific unit finalization section and functions which are being called are not immediately visible in the call stack, between InterlockedCompareExchange and FinalizeUnits:

0:000> kb
ChildEBP RetAddr  Args to Child              
0018ff3c 0040908c 0018ff78 0040909a 0018ff5c audit4_patient!System.Sysutils.InterlockedCompareExchange+0x5 [C:\Program Files (x86)\Embarcadero\RAD Studio\9.0\source\rtl\sys\InterlockedAPIs.inc @ 23]
0018ff5c 004094b2 0018ff88 00000000 00000000 audit4_patient!System.FinalizeUnits+0x40 [C:\Program Files (x86)\Embarcadero\RAD Studio\9.0\source\rtl\sys\System.pas @ 17473]
0018ff88 74b7336a 7efde000 0018ffd4 76f99f72 audit4_patient!System..Halt0+0xa2 [C:\Program Files (x86)\Embarcadero\RAD Studio\9.0\source\rtl\sys\System.pas @ 18599]
0018ff94 76f99f72 7efde000 35648d3c 00000000 kernel32!BaseThreadInitThunk+0xe
0018ffd4 76f99f45 01a5216c 7efde000 00000000 ntdll!__RtlUserThreadStart+0x70
0018ffec 00000000 01a5216c 7efde000 00000000 ntdll!_RtlUserThreadStart+0x1b

So, the simplest way to find out where we were was to step out of the InterlockedCompareExchange call. I found myself in System.SysUtils.DoneMonitorSupport (specifically, the CleanEventList subprocedure):

0:000> p
eax=01a8ee70 ebx=01a8ee70 ecx=01a8ee70 edx=00000001 esi=00000020 edi=01a26e80
eip=0042dcb1 esp=0018ff20 ebp=0018ff3c iopl=0         nv up ei pl nz na po nc
cs=0023  ss=002b  ds=002b  es=002b  fs=0053  gs=002b             efl=00200202
audit4_patient!CleanEventList+0xd:
0042dcb1 33c9            xor     ecx,ecx

After a little more spelunking, and a review of the Delphi source around this function, I found that this was a part of the System.TMonitor support. Specifically, there was a locked TMonitor somewhere that had not been destroyed. I stepped through a loop that was spinning, waiting for the object to be unlocked so its handle could be destroyed, and found a reference to the data in question here:

0:000> p
eax=00000001 ebx=01a8ee70 ecx=01a8ee70 edx=00000001 esi=00000020 edi=01a26e80
eip=0042dcaf esp=0018ff20 ebp=0018ff3c iopl=0         nv up ei pl nz na po nc
cs=0023  ss=002b  ds=002b  es=002b  fs=0053  gs=002b             efl=00200202
audit4_patient!CleanEventList+0xb:
0042dcaf 8bc3            mov     eax,ebx

Looking at the record pointed to by ebx, we had a reference to an event handle handy:

0:000> dd ebx L2
01a8ee70  00000001 00000928

  TSyncEventItem = record
    Lock: Integer;
    Event: Pointer;
  end;

Although Event is a Pointer, internally it’s just cast from an event handle. So I guess that we can probably find another reference to that handle somewhere in memory, corresponding to a TMonitor record:

  TMonitor = record
  strict private
    // ... snip ...
    var
      FLockCount: Integer;
      FRecursionCount: Integer;
      FOwningThread: TThreadID;
      FLockEvent: Pointer;
      FSpinCount: Integer;
      FWaitQueue: PWaitingThread;
      FQueueLock: TSpinLock;

And if we search for that event handle:

0:000> s -[w]d 00400000 L?F000000 00000928
01a8ee74  00000928 00000000 0000092c 00000000  (.......,.......
07649334  00000928 002c0127 0012ccb6 0000002e  (...'.,.........
0764aa14  00000928 01200125 004b8472 000037ce  (...%. .r.K..7..
07651e24  00000928 05f60125 01101abc 00000e86  (...%...........
08a47544  00000928 00000000 00000000 00000000  (...............

Now one of these should correspond to a TMonitor record. The first entry (01a8ee74) is just part of our TSyncEventItem record, and the next three don’t make sense given that the FSpinCount (the next value in the memory dump) would be invalid. So let’s look at the last one. Counting quickly on all my fingers and toes, I establish that that makes 08a47538 the start of the TMonitor record. And… so we search for a pointer to that.

0:000> s -[w]d 00400000 L?F5687000 08a47538
076b1d24  08a47538 08aa3e40 076b1db1 0122fe50  8u..@>....k.P.".

Just one! But here it gets a little tricky, because the PMonitor pointer is in a ‘hidden’ field at the end of the object. So we need to locate the start of the object.

0:000> dd 076b1d00
076b1d00  0122fe50 00000000 00000000 076b1df1
076b1d10  0122fe50 00000000 00000000 076b0ce0
076b1d20  004015c8 08a47538 08aa3e40 076b1db1
076b1d30  0122fe50 00000000 00000000 076b1d51
... snip ...

I’m just stabbing in the dark here, but that 004015c8 that’s just four bytes back smells suspiciously like an object class pointer. Let’s see:

0:000> da poi(4015c8-38)+1
004016d7  "TObject&"

Ta da! That all fits. A TObject has no data members, so the next 4 bytes should be the TMonitor (search for hfMonitorOffset in the Delphi source to learn more). So we have a TObject being used as a TMonitor lock reference. (Learn about that poi(address-38)+1 magic). But what other naughty object is hanging about, using this TObject as its lock?

0:000> s -[w]d 00400000 L?F5687000 076b1d20
098194b0  076b1d20 00000000 00000000 09819449   .k.........I...

Just one. Let’s trawl back in memory just a little bit and have a look at this one.

0:000> dd 09819480  
09819480  00f0f0f0 00ffffff 00000000 09819641
09819490  00447b7c 00000000 00000000 00000000
098194a0  00000000 098150c0 00448338 098195c8
098194b0  076b1d20 00000000 00000000 09819449
... snip ...

0:000> da poi(00448338-38)+1
004483c0  "TThreadList&"

And what does a TThreadList look like?

  TThreadList = class
  private
    FList: TList;
    FLock: TObject;
    FDuplicates: TDuplicates;

Yes, that definitely looks hopeful! That FLock is pointing to our lock TObject… I believe that’s called a Quality Match.

This is still a little bit too generic for me, though. TThreadList is a standard Delphi class used by the bucketload. Let’s try and identify who is using this list and leaving it lying about. First, we’ll quickly have a look at that TThreadList.FList to see if it has anything of interest — that’s the first data member in the object == object+4.

0:000> dd poi(098194ac)
098195c8  00447b7c 00000000 00000000 00000000
... snip ...
0:000> da poi(447b7c-38)+1
00447cad  "TList'"

Yep, it’s a TList. Just making sure. It’s empty, what a shame (TList.FCount is the second data member in the object == 00000000, as is the list pointer itself).

So how else can we find the usage of that TThreadList? Is it TThreadList referenced anywhere then? Break out the search tool again!

0:000> s -[w]d 00400000 L?F5687000 098194a8
076d3410  098194a8 00000000 09819580 00000000  ................

Yes. Just once, again. Again, we scroll back in memory to find the base of that object.

0:000> dd 076d33c0  
076d33c0  08abfe60 00000000 00000000 076d4c39
076d33d0  01616964 0000091c 00001850 00000100
076d33e0  00000001 00000000 00000000 00000000
076d33f0  076d33d0 00000000 01616d38 076d33d0
076d3400  00000000 00000000 00000000 00000000
076d3410  098194a8 00000000 09819580 00000000
076d3420  00000000 076d2ea9 0075e518 00000000
076d3430  00401ecc 00000000 00000000 00000000

There was a false positive at 076d33f8, but then magic happened at 076d33d0:

0:000> da poi(01616964-38)+1
016169e8  "TAnatomyDiagramTileLoaderThread&"

Wow! Something real! Let’s dissect this a bit. Looking at the definition of TThread, we have the following data:

076d33d0  01616964  class pointer TAnatomyDiagramTileLoaderThread
076d33d4  0000091c  TThread.FHandle
076d33d8  00001850  TThread.FThreadID
076d33dc  00000100  TThread.FCreateSuspended, .FTerminated, .FSuspended, .FFreeOnTerminate (watch that endianness!)
076d33e0  00000001  TThread.FFinished
076d33e4  00000000  TThread.FReturnValue
076d33e8  00000000  TThread.FOnTerminate.Code
076d33ec  00000000  TThread.FOnTerminate.Data
076d33f0  076d33d0  TThread.FSynchronize.TThread (= Self)
076d33f4  00000000  padding
076d33f8  01616d38  TThread.FSynchronize.FMethod.Code (= last Synchronize target method)
076d33fc  076d33d0  TThread.FSynchronize.FMethod.Data (= Self)
076d3400  00000000  TThread.FSynchronize.FProcedure
076d3404  00000000  TThread.FSynchronize.FProcedure
076d3408  00000000  TThread.FFatalException
076d340c  00000000  TThread.FExternalThread

Then, into TAnatomyDiagramTileLoaderThread:

076d3410  098194a8  TAnatomyDiagramTileLoaderThread.FTiles: TThreadList

So… we can tell that the thread has exited (FFinished == 1), and verify that by looking at running threads, looking for thread id 1850:

0:000> ~
.  0  Id: 1c98.1408 Suspend: 1 Teb: 7efdd000 Unfrozen
   1  Id: 1c98.16c8 Suspend: 1 Teb: 7efda000 Unfrozen
   2  Id: 1c98.11a0 Suspend: 1 Teb: 7ee1c000 Unfrozen
   3  Id: 1c98.1bbc Suspend: 1 Teb: 7ee19000 Unfrozen
   4  Id: 1c98.10dc Suspend: 1 Teb: 7ee04000 Unfrozen
   5  Id: 1c98.12f0 Suspend: 1 Teb: 7edfb000 Unfrozen
   6  Id: 1c98.1d38 Suspend: 1 Teb: 7efaf000 Unfrozen
   7  Id: 1c98.1770 Suspend: 1 Teb: 7edec000 Unfrozen
   8  Id: 1c98.1044 Suspend: 1 Teb: 7ede3000 Unfrozen
   9  Id: 1c98.bf4 Suspend: 1 Teb: 7ede0000 Unfrozen
  10  Id: 1c98.b3c Suspend: 1 Teb: 7efd7000 Unfrozen

Furthermore, the handle is invalid:

0:000> !handle 91c
Could not duplicate handle 91c, error 6

That suggests that the object has already been destroyed. But that the TThreadList hasn’t.

And sure enough, when I looked at the destructor for TAnatomyDiagramTileLoadThread, we clear the TThreadList, but we never free it!

Now, another way we could have caught this was to turn on leak detection. But leak detection is not always perfect, especially when you get some libraries that *cough* have a lot of false positives. And of course while we could have switched on heap leak detection, that involves rebuilding and restarting the process and losing the context along the way, with no guarantee we’ll be able to reproduce it again!

While this approach does feel a little tedious, and we did have some luck in this instance with freed objects not being overwritten, and the values we were searching for being relatively unique, it does nevertheless feel pretty deterministic, which must be better than the old “try-it-and-hope” debugging technique.
The case of the stack trace that wouldn’t (trace)

One of my favourite Windows tools is Procmon.  I pull it out regularly, often as a first port of call when diagnosing complicated and opaque problems in the software I develop.  Or in anyone’s software, really.

Procmon captures a trace of key I/O activities on your computer, including file, registry and network activity, and makes it really easy to spot operations that have failed or that may be causing problems.  It’s great for spotting authentication problems, sharing violations, missing files and more (… malware).  Procmon goes as far as recording a stack trace for nearly every operation it captures!

Today, we were trying to diagnose a problem with a process that was taking 15 seconds or longer to start on a Windows XP computer.  The normal start time for that process should have been 1-2 seconds.  None of the usual culprits came forward and admitted fault, so it was time to pull out Procmon again.

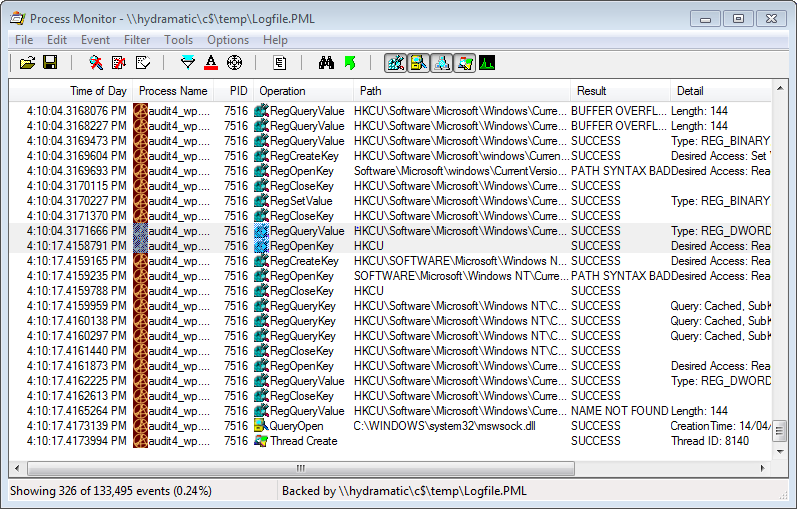
We quickly spotted a big fat delay in the trace.  Note the time stamps in the two selected rows  in the screen capture below.

A big time gap between 4:10:04 and 4:10:17

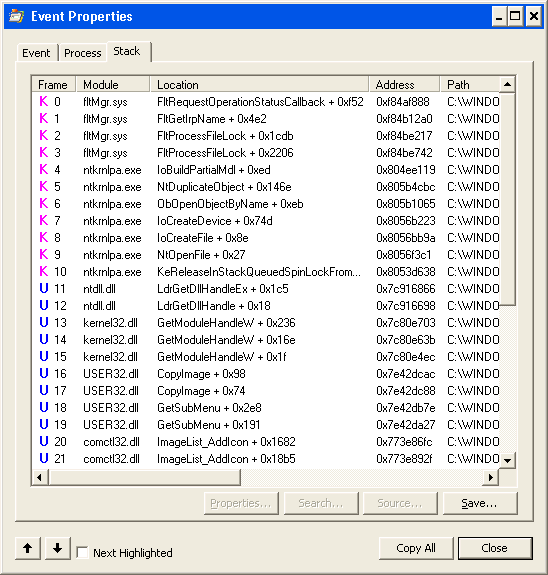
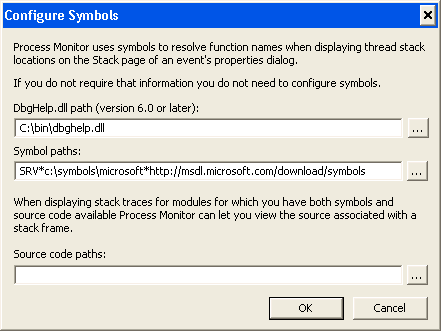
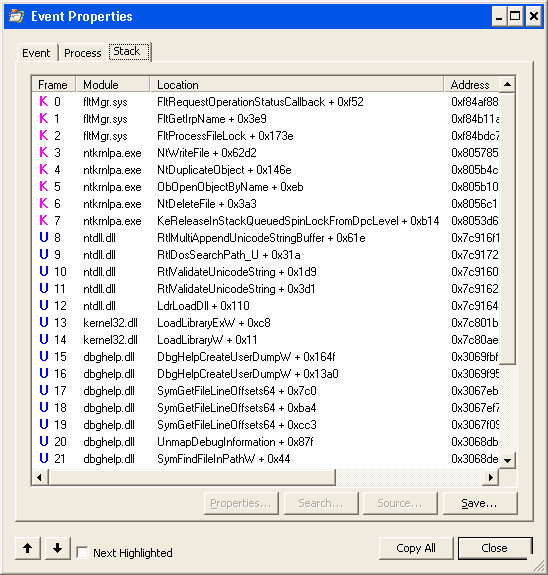
Now it was time to try and find out what was causing this.  So we examined the stack trace for each entry, except … there were no symbols.  Easy enough to fix — copy dbghelp.dll from a version of Microsoft’s Debugging Tools for Windows onto the system temporarily, fixup the symbol path in Procmon’s options, and … nope, still no symbols.  Now this is one area where Procmon falls down a little bit.  If symbol loading fails, it just silently fails.  No warnings, errors or hints as to what might be going on.

This issue was occurring on a client’s computer, so it was time to take the investigation elsewhere for examination.  Before we could really examine the captured trace, we needed to get symbols going.  But how?

Procmon to the rescue!

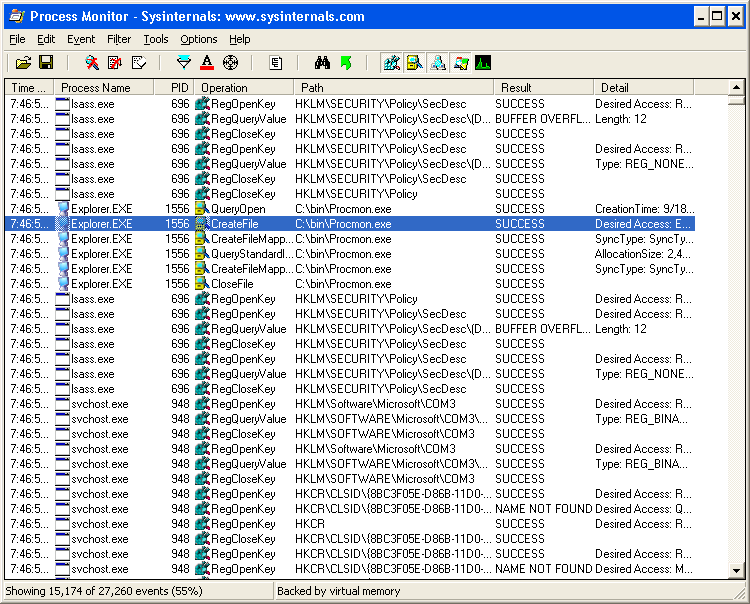
That’s right, we realised we can use Procmon to diagnose itself!  I booted up a clean new Windows XP virtual machine, loaded Procmon onto it, ran a basic capture of some random events.

A trace on XP
A trace on XP
No symbols showing, only exports
Configuring symbols for Procmon

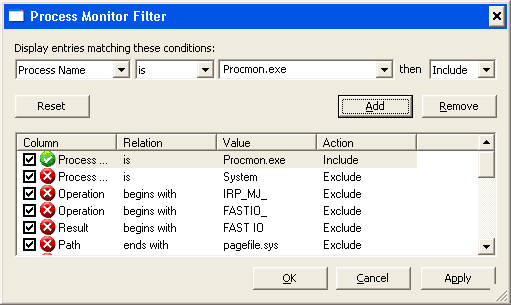
Even after configuring symbols, they still silently failed to load.  So I stopped the capture, saved it and immediately opened the saved capture, to stop this instance of Procmon from capturing events on the local computer.  I then started a second instance of Procmon, removed the Procmon exclusion from the filtering, and instead, added a filter to include Procmon (I also filtered specifically for the PID of the original Procmon, later):

Configuring Procmon to watch itself

Then I started the trace, switched back to the first Procmon, and tried to examine the stack.  Of course, still no symbols, but now it was time to switch back to the second, active Procmon process and see what we found.

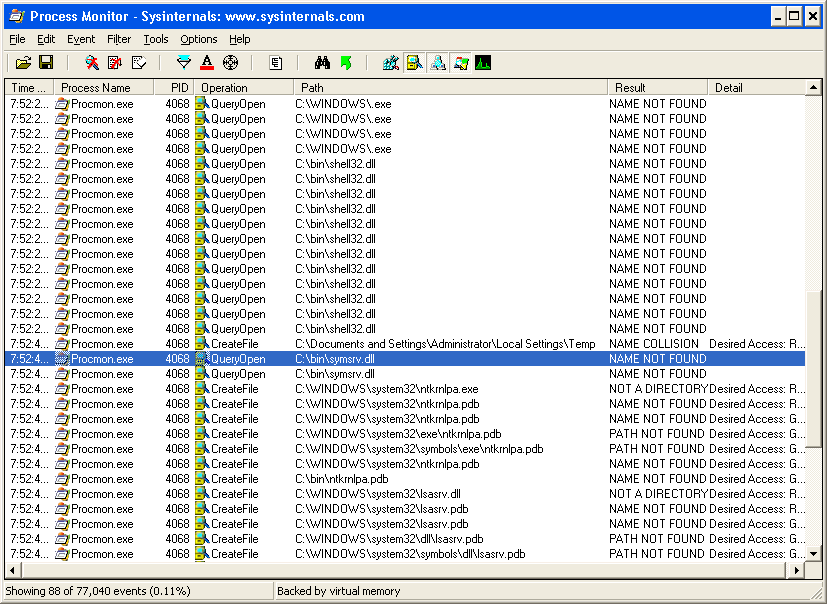
And what we found was that dbghelp.dll was looking for symsrv.dll in order to download its symbols.  So we copied that also into the folder with procmon.exe  and suddenly everything worked!

dbghelp wants symsrv to help it as well
The undecorated stack for the symsrv load request

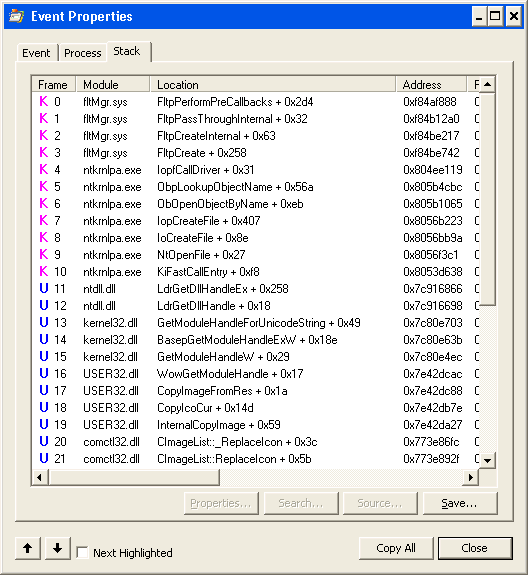
Update 19 Sep 2013: Oops.  Forgot to attach the decorated stack (sorry!):

The call stack with symbols
The call stack with symbols loaded.  Note how the function names differ from the original stack.

So that’s the first takeaway from this story: when you want symbols, copy both dbghelp.dll and symsrv.dll from your copy of Debugging Tools for Windows.  We found no other dependencies, even with the latest version of these files.

A diversion

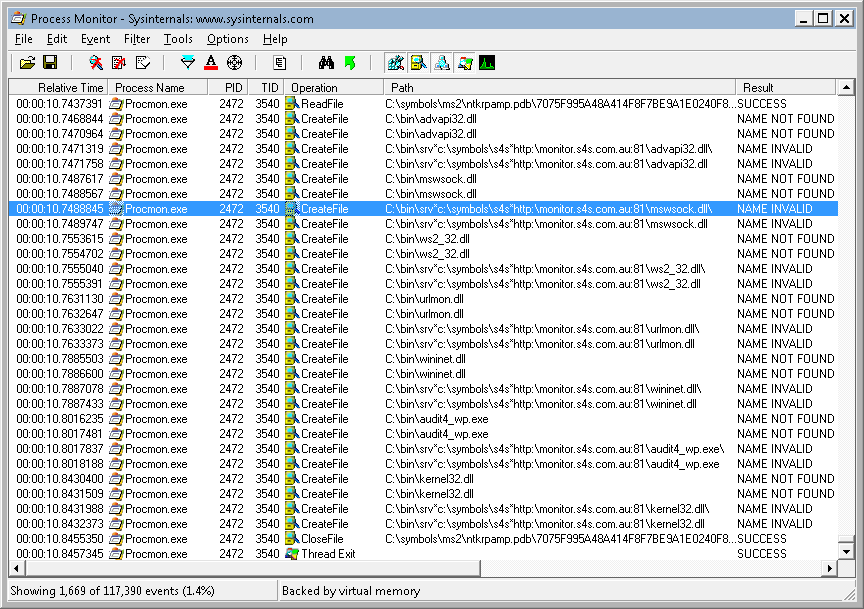
One curious anomaly we spotted: Procmon (or possibly Dbghelp) is looking in some strange places for debug symbols, including appending a SRV*path*url style symbol path to procmon’s parent path, and looking there, without much success:

Some weirdness in symbol loading

I leave that one for you to solve.

Backtrack to the stack (trace)

Back to the original trace.  We loaded up the saved trace, and found that we now got kernel mode symbols just fine, but no user mode symbols would load.  In fact, Procmon doesn’t even appear to be looking for symbols for these user mode frames — either on the local drive or on the network.  And this time Procmon isn’t able to give us any more detail.  However, when we debugged the call that Procmon made to SymFindFileInPath when viewing a call stack in this log vs another new log, we found that Procmon wasn’t even providing the necessary identifying information.

What information is this?  The identifying information that the symbol servers use is the TimeDateStamp and the SizeOfImage fields from the PE header of the executable file (slightly different for .pdb files).

I surmise that this identifying information is missing from our original trace because this trace was captured before we copied version 6.0 or later of dbghelp.dll onto the client’s computer — meaning that the version that Procmon used when capturing the trace did not record this identifying information.

Therefore, the second takeaway of the story is: always copy a recent version of dbghelp.dll and symsrv.dll into the folder with procmon.exe, before starting a trace.  Even if you intend to analyze the trace later, you’ll find that without these, you won’t get full stack traces.

(Dear Microsoft, please can you consider including these in the Procmon and Procexp downloads, given that you now own Sysinternals?  Saves a lot of hassle!)

I am happy to announce that the missing characters have been found!

Last year I published a blog post about characters missing from print jobs with Internet Explorer 9 and my adventures in tracing and reporting the issue to Microsoft.

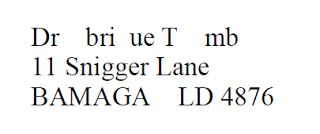
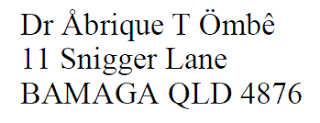
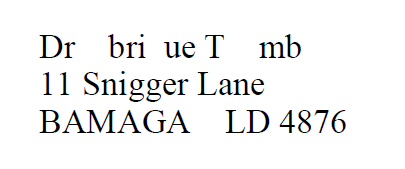
We saw situations where a letter would be printed with random letters missing, as per the following example:

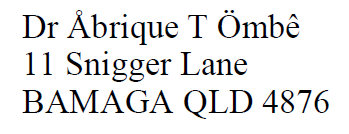
Here’s how it should have been printed (oh yes, that’s a completely fictional name we used for testing non-English Latin script letters in printing):

Today, I was notified that Microsoft have finally publicly published a hotfix!  We received the hotfix from them a few weeks ago, before it was publicly available, and it certainly solved the problem on our test machines and end user computers.

Download the hotfix from:

http://support.microsoft.com/kb/2853777 (Windows 7 SP1, Windows Server 2008 SP1) 

http://support.microsoft.com/kb/2855336 (Windows 8, Windows Server 2012)

(The first link notes that the hotfix is included in the rollup in the second link, though the second link doesn’t mention the hotfix!)

Sadly, they’ve only published a solution for Windows 7 Service Pack 1 onwards, and not for Vista, which could be an issue for some users. 

It was interesting to see that the issue was indeed a race condition (two threads ending up with the same random seed, because, and I quote:

This issue occurs because a conflict causes the text that uses the font to become corrupted when the two threads try to install the font at the same time. The name of the font is generated by the RAND function together with a SEEDvalue whose time value is set to srand(time(NULL)). When the two documents are printed at the same time, the SEEDvalue for the font is the same in both documents. Therefore, the conflict occurs.

So not related to the threading model, which was a little bit of misdirection on my part 😉  That’s par for the course though when debugging complex issues without source…

Fantastic to finally have the fix 🙂

RSA Key Exchange between CryptoAPI and CNG (BCrypt)

Microsoft, a few years ago, wrote a new cryptography API for Windows Vista called Cryptography Next Generation (CNG).  This replaces the existing cryptography API in Windows XP and earlier versions which was simply called CryptoAPI.

Now, compatibility between the two APIs is touted as a feature of the new CNG API, but a somewhat more sombre reality tends to set in pretty quickly once you start working with them.  A motley collection of loosely documented data structures, endianness differences, and “Not Supported” footnotes pile up as quickly as you can open MSDN documentation tabs in your browser.  In my research, I also found a dearth of concrete examples of how to interoperate between the two APIs online.  In fact, there was only one page which really helped, buried in Microsoft’s Output Protection Manager documentation.

There is something magical about all your bits lining up in a row when mixing crypto libraries of any ilk, and I wanted to share!  Hence this story.

My requirement was pretty simple: I wanted to generate an RSA key pair using CryptoAPI in my client application, hand off the public key to another application, which happens to use CNG, wave my hands a little, and magically transact a key exchange.  Here’s how to do it (with some error handling elided for your own reading sanity).  You should be able to load this into any recent version of Visual Studio, add bcrypt.lib to your library includes and build.  The code should be reasonably self-explanatory, so I’ll leave it there.

The usual disclaimers apply. Source on GitHub.

Delphi, Win32 and leaky exceptions

Have you ever written any Delphi code like the following snippet?  That is, have you ever raised a Delphi exception in a Win32 callback?  Or even just failed to handle potential exceptions in a callback?

    function MyWndEnumFunc(hwnd: HWND; lParam: LPARAM): BOOL; stdcall;
    begin
      if hwnd = TForm4(lParam).Handle then
        raise Exception.Create('Raise an exception just to demonstrate the issue');
      Result := True;
    end;

    procedure TForm4.FormCreate(Sender: TObject);
    begin
      try
        EnumWindows(@MyWndEnumFunc, NativeInt(Self));
      except
        on E:Exception do
          ShowMessage('Well, we unwound that exception.  But does Win32 agree?');
      end;
    end;

Raymond Chen has posted a great blog today about why that approach will eventually end in tears.  You may get away with it for a while, or you may end up with horrific stack or heap corruption. The moral of the story is, any time you have a Win32 callback function, you need to make sure no exceptions leak.  Like this:

function MyWndEnumFunc(hwnd: HWND; lParam: LPARAM): BOOL; stdcall;
begin
  try
    if hwnd = TForm4(lParam).Handle then
      raise Exception.Create('Raise an exception just to demonstrate the issue');
    Result := True;
  except
    // Handle the exception, perhaps pass it to Application.HandleException,
    // or log it, or abort your app.  Just don’t let it bubble through any
    // Win32 code.  You need to write the HandleAllExceptions function!
    HandleAllExceptions;
    Result := False;
  end;
end;

If you use Delphi’s AllocateHwnd procedure, remember that it also does not handle exceptions for you (I’ve just reported this in QualityCentral as QC108653 as this caveat should at least be documented).  So you need to do it:

procedure TForm4.MyAllocatedWindowProc(var Message: TMessage);
begin
  try
    if Message.Msg = WM_USER then
      raise Exception.Create('Go wild!');
  except
    Application.HandleException(Self);  // Or whatever, just don’t let it leak
  end;
  with Message do Result := DefWindowProc(FMyHandle, Msg, wParam, lParam);
end;

procedure TForm4.FormCreate(Sender: TObject);
begin
  FMyHandle := AllocateHwnd(MyAllocatedWindowProc);
  SendMessage(FMyHandle, WM_USER, 0, 0);
end;

Why does switching languages hang my app?

This is a very short follow-up to yesterday’s blog about WM_INPUTLANGCHANGEREQUEST, WaitForSingleObject and applications hanging.

While I thought, yesterday, that this bug was no longer such a problem on Windows Vista and Windows 7, it turns out that if you assign a hotkey to a language (e.g. Alt+Shift+2), the KLF_SETFORPROCESS flag will be set when that hotkey is pressed.  This means that this issue is still a problem today.

This is not just a problem for Delphi.  I’ve found references to Outlook hanging, .NET 4.5 WPF applications hanging, and VC++ applications hanging.

Moral of the story (again): thread-safe code is hard.  Don’t believe that your code suddenly becomes thread-safe because you synchronize it to the main thread (no matter what the Delphi documentation tells you!)

WaitForSingleObject. Why you should never use it.

Updated 30/1/2013: Fixed a typo and formatting issue or two.  Added a sentence for clarity.  See also the short follow-up post.

I’ve really struggled with how to frame this post.  It could be about the dangers of WaitForSingleObject and WaitForMultipleObjects.  Or about how Delphi’s TThread.Synchronize seems so handy, and yet because it must use WaitForSingleObject, is so fraught with complications.  Or yet, about how pressing Alt+Left Shift to switch languages could hang an application.  In the end, it’s about all three of these things.

Some people, when confronted with a problem, think, “I know, I’ll use threads,” and then two they hav erpoblesms.

Let’s start with TThread.Synchronize.  It seems a handy little function: it will, in a thread-safe manner, call a procedure in the context of the main VCL thread (the thread that owns the Delphi VCL GUI windows), and wait, using the Windows API WaitForSingleObject(INFINITE), for the procedure to return.  Simpler than fiddling with synchronisation primitives, right?  Everyone knows threading is hard, so use the well-tested thread utilities where you can?

Except that WaitForSingleObject and its big brother WaitForMultipleObjects are dangerous.  The basic problem is that these calls can cause deadlocks, if you ever call them from a thread that has its own message loop and windows.  That’s okay, you say, I don’t have any UI except in my main thread.  But any thread that uses COM can have hidden COM helper windows when doing RPC (and see below for more on this).  And other libraries can create their own windows as well, such as the ADO libraries.

So what causes the deadlock? Well, I’ll illustrate with the scenario we ran into.  Some old code (that I wrote, okay, okay) created a thread (we’ll call it BackgroundThread).  BackgroundThread used TThread.Synchronize to periodically update the UI status about a background database process it was running.  It doesn’t really matter what it was doing, but the use of Microsoft’s ADO database library meant that this thread was creating a hidden window, with the class ADODB.AsyncEventMessenger.  Behind the scenes, a second window was automatically created by Windows once we had the first window in the thread, and this one had the class name IME.

Every now and then, our BackgroundThread would call Synchronize(RefreshStatus).  This would signal an event which the main thread would check periodically from its message loop.  Eventually it would call the RefreshStatus procedure.  BackgroundThread would in the meantime have called WaitForSingleObject(INFINITE) to wait for an event to be signaled by the main thread indicating that the RefreshStatus procedure had finished.

Where are we going?  Well, if the main thread receives a message that it then decides to send on to other windows in the process, while BackgroundThread is getting ready to synchronize, we can end up in a deadlock.  And, it turns out that in Windows XP, this can happen when WM_INPUTLANGCHANGEREQUEST (0x50) is received, e.g. when the user presses Alt+Left Shift.  (Note, for this scenario to play, the Input Method Manager must be enabled — install Far Eastern language support in Windows XP).  Remember, this is just one possible scenario which can trigger a deadlock.

Let’s pull this apart.  I’ve loaded the stalled process into WinDbg, and am now looking at two call stacks which have deadlocks, in user mode.  First the main VCL GUI thread:

   0  Id: bf8.cb8 Suspend: 1 Teb: 7ffde000 Unfrozen
ChildEBP RetAddr
0012fadc 7e4194be ntdll!KiFastSystemCallRet
0012fb30 7e43652f USER32!NtUserMessageCall+0xc
0012fb50 7e418734 USER32!EditWndProcW+0x5d
0012fb7c 7e418816 USER32!InternalCallWinProc+0x28
0012fbe4 7e42a013 USER32!UserCallWinProcCheckWow+0x150
0012fc14 7e42a039 USER32!CallWindowProcAorW+0x98
0012fc34 004c0e7d USER32!CallWindowProcW+0x1b
0012fda4 004c0d80 audit4_home!Vcl.Controls.TWinControl.DefaultHandler+0xdd
0012fdf0 004c03d3 audit4_home!Vcl.Controls.TWinControl.WndProc+0x5b8
0012fe20 00467b3e audit4_home!Vcl.Controls.TWinControl.MainWndProc+0x2f
0012fe38 7e418734 audit4_home!System.ClassesStdWndProc+0x16
0012fe64 7e418816 USER32!InternalCallWinProc+0x28
0012fecc 7e4189cd USER32!UserCallWinProcCheckWow+0x150
0012ff2c 7e418a10 USER32!DispatchMessageWorker+0x306
0012ff3c 005a6980 USER32!DispatchMessageW+0xf
0012ff58 005a69c3 audit4_home!Vcl.Forms.TApplication.ProcessMessage+0xf8
0012ff7c 00d26d60 audit4_home!Vcl.Forms.TApplication.HandleMessage+0xf
0012ff9c 016e6903 audit4_home!S4s.Ui.Session.Appsession_main.TAppSession_Main.Run+0xcc
0012ffc0 7c817077 audit4_home!Audit4_home.initialization+0xc3
0012fff0 00000000 kernel32!BaseProcessStart+0x23

And then our BackgroundThread:

   9  Id: bf8.f30 Suspend: 1 Teb: 7ffd5000 Unfrozen
ChildEBP RetAddr
0494fdb8 7c90df5a ntdll!KiFastSystemCallRet
0494fdbc 7c8025db ntdll!NtWaitForSingleObject+0xc
0494fe20 7c802542 kernel32!WaitForSingleObjectEx+0xa8
0494fe34 0042d4b3 kernel32!WaitForSingleObject+0x12
0494fe80 00408a19 audit4_home!System.Sysutils.WaitForSyncWaitObj+0x7
0494fed0 004654f2 audit4_home!System.TMonitor.Wait+0x25
0494fedc 00c9f3a2 audit4_home!System.Classes.TThread.Synchronize+0x2e
0494fef8 00c9ef29 audit4_home!S4s.Br.Backgroundclasses.Backgroundclass.TBackgroundClass.SetStatus+0x8a
0494ff70 00464b11 audit4_home!S4s.Br.Backgroundclasses.Backgroundclass.TBackgroundClass.Execute+0x18d
0494ffa0 00409752 audit4_home!System.Classes.ThreadProc+0x45
0494ffb4 7c80b729 audit4_home!SystemThreadWrapper+0x2a
0494ffec 00000000 kernel32!BaseThreadStart+0x37

We can see that the main thread has sent a message somewhere.  It turns out it has sent a message to a window in the same thread (The window handle 0006040c is just the Edit window):

0012fb30 7e43652f 0006040c 00000050 00000001 USER32!NtUserMessageCall+0xc
0012fb50 7e418734 0006040c 00000050 00000001 USER32!EditWndProcW+0x5d

So why is it stalling?  It’s hard to determine here, because everything bad is happening in kernel mode, behind that KiFastSystemCallRet call. That must mean it’s time to step into kernel mode!  In WinDbg, press Ctrl+K, select Local.  I’m learning here, so this is as much for my own documentation as to explain to anyone else (in other words, if it doesn’t make sense to you, it won’t make sense to me, either, in 6 weeks time).  First, we find the process details:

lkd> !process 0 0 audit4_home.exe
PROCESS 894c3710  SessionId: 0  Cid: 0bf8    Peb: 7ffdf000  ParentCid: 0e0c
DirBase: 0a5c0700  ObjectTable: 00000000  HandleCount:   0.
Image: audit4_home.exe

PROCESS 893277e0  SessionId: 0  Cid: 0d94    Peb: 7ffd8000  ParentCid: 0e0c
DirBase: 0a5c0720  ObjectTable: 00000000  HandleCount:   0.
Image: audit4_home.exe

PROCESS 8950d9a8  SessionId: 0  Cid: 0f10    Peb: 7ffdb000  ParentCid: 0e0c
DirBase: 0a5c0740  ObjectTable: 00000000  HandleCount:   0.
Image: audit4_home.exe

PROCESS 89566758  SessionId: 0  Cid: 0520    Peb: 7ffde000  ParentCid: 0e0c
DirBase: 0a5c0840  ObjectTable: e127a330  HandleCount: 467.
Image: audit4_home.exe

We’ll look at the last process listed, being the one with the problem (the other three are defunct):

lkd> !process 89566758 2
PROCESS 89566758  SessionId: 0  Cid: 0520    Peb: 7ffde000  ParentCid: 0e0c
DirBase: 0a5c0840  ObjectTable: e127a330  HandleCount: 467.
Image: audit4_home.exe

THREAD 8953a920  Cid 0520.009c  Teb: 7ffdd000 Win32Thread: e1210eb0 WAIT: (Suspended) KernelMode Non-Alertable
SuspendCount 1
FreezeCount 1
8953aabc  Semaphore Limit 0x2

THREAD 8963bda0  Cid 0520.0a98  Teb: 7ffd9000 Win32Thread: 00000000 WAIT: (Suspended) KernelMode Non-Alertable
SuspendCount 1
FreezeCount 1
8963bf3c  Semaphore Limit 0x2

THREAD 8953b9a0  Cid 0520.03c8  Teb: 7ffd8000 Win32Thread: 00000000 WAIT: (Suspended) KernelMode Non-Alertable
SuspendCount 1
FreezeCount 1
8953bb3c  Semaphore Limit 0x2

THREAD 895a2c08  Cid 0520.021c  Teb: 7ffd7000 Win32Thread: 00000000 WAIT: (Suspended) KernelMode Non-Alertable
SuspendCount 1
FreezeCount 1
895a2da4  Semaphore Limit 0x2

THREAD 898f8cc8  Cid 0520.0bd8  Teb: 7ffd4000 Win32Thread: e2d75870 WAIT: (Suspended) KernelMode Non-Alertable
SuspendCount 1
FreezeCount 1
898f8e64  Semaphore Limit 0x2

THREAD 893287f8  Cid 0520.0eec  Teb: 7ff4f000 Win32Thread: 00000000 WAIT: (Suspended) KernelMode Non-Alertable
SuspendCount 1
FreezeCount 1
89328994  Semaphore Limit 0x2

THREAD 89308c30  Cid 0520.00f0  Teb: 7ff4e000 Win32Thread: 00000000 WAIT: (Suspended) KernelMode Non-Alertable
SuspendCount 1
FreezeCount 1
89308dcc  Semaphore Limit 0x2

THREAD 89ab4020  Cid 0520.01b0  Teb: 7ff4d000 Win32Thread: e2ed4260 WAIT: (Suspended) KernelMode Non-Alertable
SuspendCount 1
FreezeCount 1
89ab41bc  Semaphore Limit 0x2

THREAD 893269b0  Cid 0520.0830  Teb: 7ff4c000 Win32Thread: e23bf2c0 WAIT: (Suspended) KernelMode Non-Alertable
SuspendCount 1
FreezeCount 1
89326b4c  Semaphore Limit 0x2

THREAD 89895778  Cid 0520.0ce0  Teb: 7ff4b000 Win32Thread: e2fa06e8 WAIT: (Suspended) KernelMode Non-Alertable
SuspendCount 1
FreezeCount 1
89895914  Semaphore Limit 0x2

THREAD 8933ba80  Cid 0520.0e08  Teb: 7ff4a000 Win32Thread: 00000000 WAIT: (Suspended) KernelMode Non-Alertable
SuspendCount 1
FreezeCount 1
8933bc1c  Semaphore Limit 0x2

THREAD 89322728  Cid 0520.0f28  Teb: 7ff49000 Win32Thread: 00000000 WAIT: (Suspended) KernelMode Non-Alertable
SuspendCount 1
FreezeCount 1
893228c4  Semaphore Limit 0x2

THREAD 89449960  Cid 0520.0ab0  Teb: 7ff48000 Win32Thread: e12d5590 WAIT: (Suspended) KernelMode Non-Alertable
SuspendCount 1
FreezeCount 1
89449afc  Semaphore Limit 0x2

THREAD 8952d020  Cid 0520.09dc  Teb: 7ffdc000 Win32Thread: 00000000 WAIT: (Executive) KernelMode Non-Alertable
SuspendCount 1
b8c197d4  SynchronizationEvent

And we can see the first thread has the address 8953a920.  So let’s look at that (flag 16 means show the full stack in the process context, with parameters).

lkd> !thread 8953a920 16
THREAD 8953a920  Cid 0520.009c  Teb: 7ffdd000 Win32Thread: e1210eb0 WAIT: (Suspended) KernelMode Non-Alertable
SuspendCount 1
FreezeCount 1
8953aabc  Semaphore Limit 0x2
Not impersonating
DeviceMap                 e1050c08
Owning Process            0       Image:
Attached Process          89566758       Image:         audit4_home.exe
Wait Start TickCount      213083         Ticks: 67800 (0:00:17:39.375)
Context Switch Count      20200  NoStackSwap    LargeStack
UserTime                  00:00:00.781
KernelTime                00:00:01.484
Win32 Start Address audit4_home!Audit4_home.initialization (0x016e6840)
Start Address kernel32!BaseProcessStartThunk (0x7c810705)
Stack Init b7c1f000 Current b7c1e840 Base b7c1f000 Limit b7c19000 Call 0
Priority 10 BasePriority 8 PriorityDecrement 0 DecrementCount 16
ChildEBP RetAddr  Args to Child
b7c1e858 80503864 8953a990 8953a920 804fb094 nt!KiSwapContext+0x2f (FPO: [Uses EBP] [0,0,4])
b7c1e864 804fb094 8953aa8c 8953a920 8953a954 nt!KiSwapThread+0x8a (FPO: [0,0,0])
b7c1e88c 80502fa0 00000000 00000005 00000000 nt!KeWaitForSingleObject+0x1c2 (FPO: [5,5,4])
b7c1e8a4 804ff8e0 00000000 00000000 00000000 nt!KiSuspendThread+0x18 (FPO: [3,0,0])
b7c1e8ec 80503882 00000000 00000000 00000000 nt!KiDeliverApc+0x124 (FPO: [3,10,0])
b7c1e904 804fb094 00000240 e1210eb0 00000000 nt!KiSwapThread+0xa8 (FPO: [0,0,0])
b7c1e92c bf802f15 00000000 0000000d 00000001 nt!KeWaitForSingleObject+0x1c2 (FPO: [5,5,4])
b7c1e968 bf835eb7 00000200 00000000 00000000 win32k!xxxSleepThread+0x192 (FPO: [3,5,4])
b7c1ea04 bf8141d2 bbe83720 00000287 00000019 win32k!xxxInterSendMsgEx+0x7f6 (FPO: [Non-Fpo])
b7c1ea50 bf80ecd9 bbe83720 00000287 00000019 win32k!xxxSendMessageTimeout+0x11f (FPO: [7,7,0])
b7c1ea74 bf92b42e bbe83720 00000287 00000019 win32k!xxxSendMessage+0x1b (FPO: [4,0,0])
b7c1eaa4 bf92c675 e2d75870 e13f10e0 e13f10e0 win32k!xxxImmActivateLayout+0x5b (FPO: [2,3,4])
b7c1ec08 bf8696d9 00000004 00000000 e13f10e0 win32k!xxxImmActivateThreadsLayout+0x10c (FPO: [3,82,4])
b7c1ec48 bf86862f e13f10e0 00000100 bbe88228 win32k!xxxInternalActivateKeyboardLayout+0xb7 (FPO: [3,8,4])
b7c1ec70 bf80b5a7 8989a2d0 04090c09 00000100 win32k!xxxActivateKeyboardLayout+0x4c (FPO: [4,3,0])
b7c1ecd4 bf80ec9f bbe88228 00000050 00000001 win32k!xxxRealDefWindowProc+0x56d (FPO: [4,16,0])
b7c1ecec bf81c176 bbe88228 00000050 00000001 win32k!xxxWrapRealDefWindowProc+0x16 (FPO: [5,0,0])
b7c1ed08 bf80eee6 bbe88228 00000050 00000001 win32k!NtUserfnNCDESTROY+0x27 (FPO: [7,0,0])
b7c1ed40 8054168c 0006040c 00000050 00000001 win32k!NtUserMessageCall+0xae (FPO: [7,3,0])
b7c1ed40 7c90e514 0006040c 00000050 00000001 nt!KiFastCallEntry+0xfc (FPO: [0,0] TrapFrame @ b7c1ed64)
0012fadc 7e4194be 7e428e0d 0006040c 00000050 ntdll!KiFastSystemCallRet (FPO: [0,0,0])
0012fb30 7e43652f 0006040c 00000050 00000001 USER32!NtUserMessageCall+0xc
0012fb50 7e418734 0006040c 00000050 00000001 USER32!EditWndProcW+0x5d (FPO: [4,0,4])
0012fb7c 7e418816 7e4364cf 0006040c 00000050 USER32!InternalCallWinProc+0x28
0012fbe4 7e42a013 00000000 7e4364cf 0006040c USER32!UserCallWinProcCheckWow+0x150 (FPO: [Non-Fpo])
0012fc14 7e42a039 7e4364cf 0006040c 00000050 USER32!CallWindowProcAorW+0x98 (FPO: [6,0,0])
0012fc34 004c0e7d 7e4364cf 0006040c 00000050 USER32!CallWindowProcW+0x1b (FPO: [5,0,0])
0012fda4 004c0d80 02940d99 02bb9430 fffffffe audit4_home!Vcl.Controls.TWinControl.DefaultHandler+0xdd
0012fdf0 004c03d3 0012fe04 004c03eb 0012fe20 audit4_home!Vcl.Controls.TWinControl.WndProc+0x5b8
0012fe20 00467b3e 00000050 00000001 04090c09 audit4_home!Vcl.Controls.TWinControl.MainWndProc+0x2f
0012fe38 7e418734 0006040c 00000050 00000001 audit4_home!System.ClassesStdWndProc+0x16
0012fe64 7e418816 02940d99 0006040c 00000050 USER32!InternalCallWinProc+0x28
0012fecc 7e4189cd 00000000 02940d99 0006040c USER32!UserCallWinProcCheckWow+0x150 (FPO: [Non-Fpo])
0012ff2c 7e418a10 0012ff60 00000000 0006040c USER32!DispatchMessageWorker+0x306 (FPO: [Non-Fpo])
0012ff3c 005a6980 0012ff60 00120100 0012ff9c USER32!DispatchMessageW+0xf (FPO: [1,0,0])
0012ff4c 7c910222 0000000f 028458e0 005a69c3 audit4_home!Vcl.Forms.TApplication.ProcessMessage+0xf8
0012ff9c 016e6903 0012ffb0 016e6916 0012ffc0 ntdll!RtlpAllocateFromHeapLookaside+0x42 (FPO: [Non-Fpo])
0012ffc0 7c817077 7c910222 0000000f 7ffde000 audit4_home!Audit4_home.initialization+0xc3
0012fff0 00000000 016e6840 00000000 00000018 kernel32!BaseProcessStart+0x23 (FPO: [Non-Fpo])

Highlighted above there is a call to win32k!xxxSendMessage.  This is passed the address of a window at bbe83720.  And when we look at that, we see the following:

lkd> dd bbe83720
bbe83720  000d01fe 00000006 e2d75870 8998ae50

And window 000d01fe is the IME window for the other, deadlocked thread!  Why is the kernel sending a message to another thread here and now?  And without a timeout?  That’s our deadlock.  We know how it happens, but I at least still don’t know why!

Still, that’s a step forward.  Next was to figure out why we were getting that.  After a fair bit of exploration, I looked at little harder at the call stack, and decided to investigate the parameters for xxxActivateKeyboardLayout:

8989a2d0 04090c09 00000100 win32k!xxxActivateKeyboardLayout+0x4c 

That third parameter in xxxActivateKeyboardLayout corresponds to the Flags parameter for ActivateKeyboardLayout.  Perusing the documentation for the Windows ActivateKeyboardLayout function, we can see that 0x100 is KLF_SETFORPROCESS.  Bingo!  That sounds pretty suspicious!  I worked through the assembly code for xxxActivateKeyboardLayout and xxxRealDefWindowProc, and sure enough, that was it: when xxxRealDefWindowProc processes WM_INPUTLANGCHANGEREQUEST, it sets the Flags parameter to 0x0100:

win32k!xxxRealDefWindowProc+0x44d:
8211f1dd 56              push    esi
8211f1de 6800010000      push    100h
8211f1e3 ff7514          push    dword ptr [ebp+14h]
8211f1e6 6a00            push    0
8211f1e8 e8dfe40100      call    win32k!_GetProcessWindowStation (8213d6cc)
8211f1ed 50              push    eax
8211f1ee e838bdf9ff      call    win32k!xxxActivateKeyboardLayout (820baf2b)

In Windows Vista and later versions, this problem does not arise as frequently, because the Text Services Framework takes over the Alt+Left Shift command (before DefWindowProc gets a look-in) and calls ActivateKeyboardLayout without the KLF_SETFORPROCESS flag set.  However, the issue can still arise if you ever use that flag in your own code when calling ActivateKeyboardLayout.

To summarize, it’s helpful to remember that technically, we were using the functions as designed.  The primary issue is combination of design flaws, first, with how that KLF_SETFORPROCESS flag is handled: either the kernel code should be using a timeout when it sends the message to the other thread, or it should be queuing an event for the other thread to handle when it gets around to it; and second, with TThread.Synchronize, which unfortunately by design cannot be robust against deadlocks.

In any case, to make your own code more robust:

  1. Determine, when using synchronisation calls, if there is any chance that windows could be created by your thread, and if so, use MsgWaitForMultipleObjects and a message loop instead of WaitForSingleObject or WaitForMultipleObjects.  Check the libraries you are using, and if you are using COM, it’s safest to assume that windows will be created.
  2. Don’t use the TThread.Synchronize procedure.  Recent versions of Delphi include TThread.Queue, which is asynchronous, and so avoids this deadlock.
  3. Think carefully about whether a thread is the right solution to the problem.
  4. Don’t use the KLF_SETFORPROCESS flag!

Mixing RTL and LTR: Plaintext vs HTML

Just a very short post today.  We still have some way to go in mixing RTL and LTR text.  For example, the following image, snipped from Outlook 2010, shows the issue:

The subject and body both say the same thing, but the display order is different.  Do you know why?  It’s because the subject is plain text and is assuming that the text is primarily right-to-left, whereas the body is HTML, and is assuming that the text is primarily left-to-right.

Note how the full stop in the subject appears to the left of the English text.  This is because the display renderer has assumed that the whole run of text is right-to-left, so punctuation is treated as right-to-left, and so displays after (in a right-to-left sense) the text.

The question is, of course, how do you determine directionality given an arbitrary plain text string?  It’s not really possible to do so reliably in the absence of other metadata.  The W3C article on directionality is helpful here: http://www.w3.org/TR/html4/struct/dirlang.html

Another view of the message:

Interestingly, Outlook Web Access does not do this, because its UI takes its directionality from the base HTML document:

When characters go astray: diagnosing missing characters when printing with IE9

I was recently landed with a real doozy of a support case: on some systems, under some circumstances, print jobs would be missing random characters.  Like the following image:

print-1

As opposed to how it should appear:

print-2

This example is missing the following letters:  Å ê Ö q Q

In this particular example, you may be misled into thinking the problem is just with non-ASCII characters.  But note that both upper case Q and lower case q are missing as well.  Other example documents that we collected had no non-ASCII characters in them at all.  I just used this example because it was one of the few we captured with fake data as opposed to real customer data.

This problem was not particularly printer dependent, and could be replicated (thank goodness!) with a PDF print driver.  But the circumstances behind replicating the problem were a little strange: it only occurred, in the second document printed, when more than one print job was sent to the printer in quick succession.  Some combinations of documents did not reflect the issue.  If we sent the documents in the opposite order, they would often succeed.  We were unable to replicate the problem on the printer in our office.

After many tries, I finally managed to replicate the issue on my development machine.  Now I could break out the debugging tools and start some tracing.

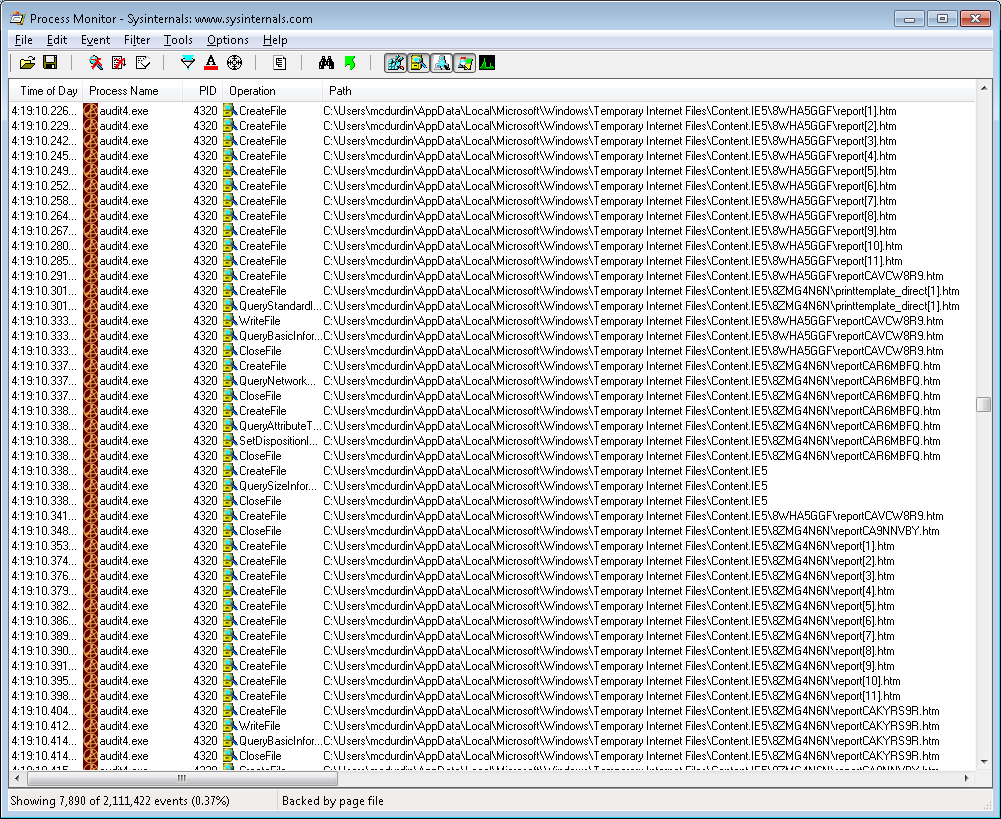
I first used Process Monitor to capture details about temporary files in the print process.  A lot of temporary files were generated.  I examined many of them, but the files appeared intact: the problem was not reflected at this point in the print job.

print-3

Next I attached a debugger to the process to try and figure out if I could spot any issues during the print itself.  I put a breakpoint on GDI32!StartDocW and when that fired, enabled a breakpoint on GDI32!ExtTextOutW.  This showed me all the strings that were being sent to the page during the print job.

Unfortunately, Internet Explorer 9 uses a process of printing to XPS and then converting that output to GDI commands for printing.  The library which does the conversion from XPS to GDI used the flag ETO_GLYPH_INDEX when calling ExtTextOutW.  This meant that examining the data in the debugger was pretty much a non-starter, without any easy to spot strings.  So eventually I decided to log the whole lot to a text file, and pull the TrueType font glyph indices in the hope that the information in the TTF file would be sufficient to reconstruct the original text strings.

As it turned out, I was trivially able to match that data up to the XPS data by generating the report as an XPS.  These are just a ZIP file with fonts, images and XML rendering data embedded.  Easy to spelunk.  It certainly seems that the correct glyph indices were being sent to the print engine.  I matched these up between the data captured in the debugger as follows.

The text string:

Dr Åbrique T Ömbê

The XPS element:

Pulling out just the Glyph indices from the XPS element:

39;85;3;99;69;85;76;84;88;72;3;55;3;103;80;69;114

Converting those glyph indices to hexadecimal:

0027 0055 0003 0063 0045 0055 004c 0054
0058 0048 0003 0037 0003 0067 0050 0045
0072

Matching the data captured from ExtTextOutW:

233a4fe0  00550027 00630003 00550045 0054004c
233a4ff0  00480058 00370003 00670003 00450050
233a5000  abab0072

Note that the DWORDs are reversed because Intel uses little endian byte order (and abab is just garbage past the end of the array).

This suggested that the font data itself is being corrupted.  Next, to check the font data in the .ps file as it is generated!  Helpfully, PrimoPDF stores a .ps file in a temporary folder during the conversion to PDF.  So it was just a matter of grabbing that file and looking at that.  Well, of course PostScript and RTF are near the top of the list of painfully unreadable file formats, but a little trial and error (and GhostScript) found me the following:

779 1636 M [66 31 23 66 46 30 26 46 45 41 23 56 23 66 71 46  0]xS

Of which, 080B03380E0B1B3905090322033A0D0E3B should translate to Dr Åbrique T Ömbê:

08 0B 03 38 0E 0B 1B 39 05 09 03 22 03 3A 0D 0E 3B
D  r     Å  b  r  i  q  u  e     T     Ö  m  b  ê

Interestingly, the missing glyphs are all in the range 38-3B in this example.  This line is identical in a version of the file that printed without errors, but the font data is quite different.

Right, so we know data corruption is occurring in the font data.  But we knew that data corruption was the issue already.  So where are we now?  Have I accomplished anything by going down this track?  Yes!  I know now that it is happening in the conversion of an XPS document to GDI, in the print process.  Given this and that it happens only when 2 documents are printed, it is almost certainly a threading issue in the XPS to GDI library.

Armed with that new-found knowledge, I set out to build a minimal test application.  Here’s the very hacky test case I ended up with:

#include "stdafx.h"

int Print(LPWSTR inFile, LPWSTR outFile, LPWSTR printer);

int _tmain(int argc, _TCHAR* argv[]) {
  if(argc < 2) {
    printf("Usage: XpsThread Apartment|Multi [PathToXPSFiles] [Printer]\n");
    return 1;
  }

  if(_wcsicmp(argv[1], L"Apartment") == 0)
    CoInitializeEx(0, COINIT_APARTMENTTHREADED);
  else
    CoInitializeEx(0, COINIT_MULTITHREADED);

  /* This assumes 2 files named 0.xps and 1.xps.  No need to make more complex at this stage. */

  WCHAR inFile[MAX_PATH], outFile[MAX_PATH];

  PWCHAR printer = argc > 3 ? argv[3] : L"PrimoPDF";

  for(int i = 0; i < 2; i++)
  {
    wsprintf(inFile, L"%s%s%d.xps", argc > 2 ? argv[2] : L"", argc > 2 ? (*(wcschr(argv[2],0)-1) == '\\' ? L"" : L"\\") : L"", i);
    wsprintf(outFile, L"%s%s%d.ps", argc > 2 ? argv[2] : L"", argc > 2 ? (*(wcschr(argv[2],0)-1) == '\\' ? L"" : L"\\") : L"", i);

    Print(inFile, outFile, printer);
  }

  getchar();  // Manually wait for print jobs to finish.

  CoUninitialize();
  // Examine the .ps files in GSview or whatever takes your fancy.  The second file generated will often be corrupt if COINIT_MULTITHREADED is used.
  return 0;
}

int Print(LPWSTR inFile, LPWSTR outFile, LPWSTR printer) {
  IXpsPrintJobStream *docStream = NULL;
  HRESULT hr;

  hr = StartXpsPrintJob(printer, NULL, outFile, 0, 0, NULL, 0, NULL, &docStream, NULL);
  if(SUCCEEDED(hr)) {
    FILE *fp = _wfopen(inFile, L"rb");
    BYTE buf[512];
    int n = fread(buf, 1, 512, fp);
    ULONG sz;
    while(n > 0) {
      docStream->Write(buf, n, &sz);
      n = fread(buf, 1, 512, fp);
    }
    fclose(fp);

    hr = docStream->Close();
    if(SUCCEEDED(hr)) {
      wprintf(L"Succeeded: %s\n", inFile);
      return 0;
    }
  }

  wprintf(L"Failed to print %s: %x\n", inFile, hr);
  return 1;
}

It may have been a little hacky, but it proved the bug.  It turns out, printing multiple documents at once with COM initialised with the flag COINIT_MULTITHREADED will consistently fail, even though that is the mode used in the example in MSDN.

Okay, so let’s take that information back to our application in Windbg, and see if we can find anything in MSHTML’s printing.  I popped in a couple of breakpoints:

bp coinitializeex ".echo ---CoInitializeEx---; ~.; dd esp+8 L1; gc"
bp gdi32!startdocw ".echo ---StartDocW---; ~.;"

The first would show me the thread ID and the COINIT flags issued every time CoInitializeEx was called.  The second would break when StartDoc was called to start a print job, from the XPS printing code (XpsGdiConverter.dll).  This would tell me the threading mode for the thread.  And as I was now expecting, MSHTML uses COINIT_MULTITHREADED (= 00000000).

---CoInitializeEx---
.  2  Id: 1464.f80 Suspend: 1 Teb: 7efd7000 Unfrozen
Start: mshtml!ShowModelessHTMLDialog+0x5460 (6dc0d50e)
Priority: 0  Priority class: 32  Affinity: f
189ef0b4  00000000
---StartDocW---
.  2  Id: 1464.f80 Suspend: 1 Teb: 7efd7000 Unfrozen
Start: mshtml!ShowModelessHTMLDialog+0x5460 (6dc0d50e)
Priority: 0  Priority class: 32  Affinity: f

Interestingly, when I was researching XPS printing in MSDN, I came across a page in the .NET Framework documentation which contains the following detail:

The three-parameter AddJob(String, String, Boolean) overload of AddJob must run in a single thread apartment whenever the Boolean parameter is false, which it must be when a non-XPSDrv printer is being used. However, the default apartment state for Microsoft .NET is multiple thread. This default must be reversed since the example assumes a non-XPSDrv printer

There are two ways to change the default. One way is to simply add the STAThreadAttribute (that is, “[System.STAThreadAttribute()]”) just above the first line of the application’s Main method (usually “static void Main(string[] args)”). However, many applications require that the Main method have a multi-threaded apartment state, so there is a second method: put the call to AddJob(String, String, Boolean) in a separate thread whose apartment state is set to STA with SetApartmentState. The example below uses this second technique.

This little detail is not in the Win32 XPS documentation. I can’t prove that this is the cause of the problem but it certainly seems suspicious that this goes wrong with MSHTML.  I tried a very naughty test whereby I overrode the COINIT flags whenever CoInitializeEx was called (WinDbg: bp ole32!coinitializeex “ed esp+8 2; gc”), and the problem “went away” … it’s a nice finger-in-the-wind test but certainly not conclusive!

The problem does not occur on the printer in our office, because it is an XPSDrv printer.  The problem only occurs with drivers that do not support XPS, because XPSDrv does not require apartment threading.

Anyway, I think it’s time to take this case to Microsoft.  In the meantime, the safest workaround is to wait for the first print job to finish before starting a subsequent one.  We’ll probably put that fix in for now, even though it makes the print tediously slow!

Second Rant: Why oh why does Adobe Reader need to restart?

Updated: 3:50pm — It gets worse — see below!
 
Have you ever restarted Windows (e.g. after installing Windows updates) and then been presented with the following dialog:

 And of course, once you click that Install button, you eventually end up with the following:

(For the pedantic reader, yes, I captured different versions of Adobe Reader Updater on different machines.  I’ve had to deal with this on 3 machines so far today. Get over it!)

Here’s why Adobe Reader needs to restart, even if you have nothing apparently running: the installer does not shut down the background processes AdobeARM.exe and reader_sl.exe (and possibly others).

For example on my Windows 7 x64 test machine, in Event Viewer, you can see the following events.

Product: Adobe Reader 9.5.2. The file C:\Program Files (x86)\Adobe\Reader 9.0\Reader\reader_sl.exe is being used by the following process: Name: reader_sl , Id 3084.

Product: Adobe Reader 9.5.2. The file C:\Program Files (x86)\Common Files\Adobe\ARM\1.0\AdobeARM.exe is being used by the following process: Name: AdobeARM , Id 3096.

Both these processes are part of Adobe Reader, and they should be shut down by the installer.  But the updater does not do this.  So, you are forced to restart.  This happens even if you don’t open your web browser or any other applications!

So before clicking that fateful Install button, go and kill those Adobe processes hanging around so you can avoid that restart.  Also, you will need to close your web browser(s), Office applications, and anything else that you can think of that may also be involved.  It’s a pain, but it’s still better than restarting.

Update: Killing AdobeARM.exe at the wrong time is a bit of an issue.  Because AdobeARM.exe presents the front end to the updater!  This means that if you kill AdobeARM.exe, the update dialog also disappears.  The tricky fix then, is to kill AdobeARM.exe just after clicking the Install button.  You get no feedback on the install, but you can see msiexec.exe (up to 3 instances during the install) running in Task Manager or Process Explorer.  When it finishes, two of those will close down (the last instance hangs around for a while).  It will usually leave a happy message in the Event Log.

A little extra rant?  How poor is that design? Pushing updates for the updater in such a way that it forces a restart…  A little bit of forethought could have avoided that one, Adobe.