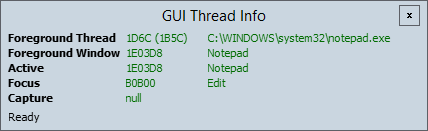
A very quick one today. GUIInfo is a tiny little utility that has a narrow purpose: it shows, in realtime, the current active, focus, foreground and capture window information for Windows.
Why this utility? Debugging focus issues is always frustrating. Attempting to observe current window focus information in a debugger results in the focus changing (to the debugger, of course). You can work around this – use remote debugging, or add logging in the debugger – but it’s a hassle.
Debugging focus issues would make Werner Heisenberg feel right at home.
Screenshot
Features
Updates 10 times a second so changes are reflected promptly.
Changes are highlighted in green, and slowly fade back to black.
Hovering over bold window labels will highlight the relevant window on the screen.
Topmost, so you can see the information without needing to try and keep the window visible.
Delphi XE2 and later versions have a robust theming system that has a frustrating flaw: the client width and height are not reliably preserved when the theme changes the border widths for dialog boxes.
For forms that are sizeable this is not typically a problem, but for dialogs laid out statically this can look really ugly, as shown in this Stack Overflow question.
The problem in pictures
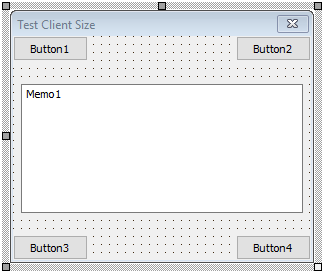
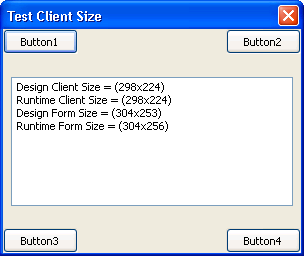
Here’s a little form, shown in the Delphi form designer. I’ve placed 4 buttons right in the corners of the form. I’m going to populate the Memo with notes on the form size at runtime.
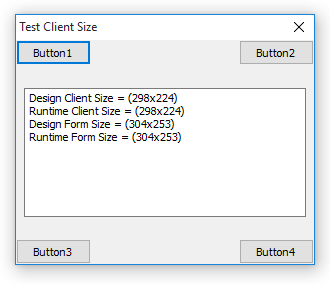
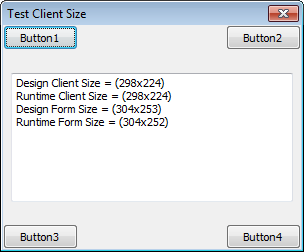
When I have no custom style set to the project (i.e. “Windows” style), I can run on a variety of platforms and see the buttons are where they should be. Shown here on Windows 10, Windows 7 and Windows XP (just because):
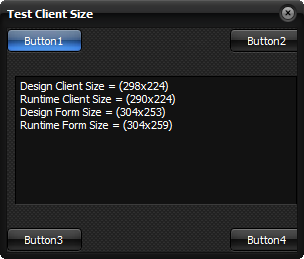
But when I apply a custom style to the project — I chose “Glossy” — then my dialog appears like so, instead:
You’ll note that the vertical is adjusted but the horizontal is not: Button2 and Button4 are now chopped off on the right. Because we are using themes, the form looks identical on all platforms.
For my needs, I found a workaround using a class helper, which can be applied to the forms which need to maintain their design-time ClientWidth and ClientHeight. This is typically the case for dialog boxes.
This workaround should be used with care as it has been designed to address a single issue and may have side effects.
It will trigger resize events at load time
Setting AutoScroll = true means that ClientWidth and ClientHeight are not stored in the form .dfm, and so this does not work.
It may not address other layout issues such as scaled elements scaling wrongly (I haven’t tested this).
type
  TFormHelper = class helper for Vcl.Forms.TCustomForm
  private
    procedure RestoreDesignClientSize;
  end;

procedure TfrmTestSize.FormCreate(Sender: TObject);
begin
  RestoreDesignClientSize;
end;

{ TFormHelper }

procedure TFormHelper.RestoreDesignClientSize;
begin
  if BorderStyle in [bsSingle, bsDialog] then
  begin
    if Self.FClientWidth > 0 then ClientWidth := Self.FClientWidth;
    if Self.FClientHeight > 0 then ClientHeight := Self.FClientHeight;
  end;
end;
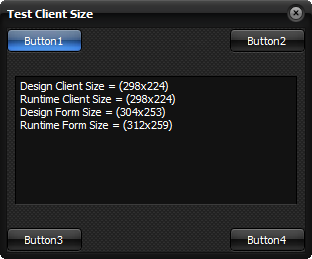
After adding in this little snippet, the form is now restored to its design-time size, like thus:
One of my dev machines has long had a weird anomaly where file operations in Explorer that should prompt for UAC, such as copying a file into C:\Program Files, would instead silently fail.
This led to all sorts of issues, from being unable to delete certain files — they’d just obstinately sit there, no matter how much I pressed that Del key — to trying to move folders containing a hidden Thumbs.db file and being unable to move the folder.
My UAC settings were the Windows defaults. Nothing weird these. So I’d always treated put this issue into my “too busy to solve this now” basket. The classic basket case. But today I finally got fed up.
After a quick search for the symptoms on Dr Google returned no results of significance, I decided I needed to trace the cause myself.
Process Monitor to the Rescue
It was time to pull out Process Monitor out of my toolbox again! Process Monitor is a tool from the SysInternals Suite by Microsoft that monitors and logs details on a bunch of different operations on your computer. I use Process Monitor, Procmon for short, all the time to solve problems big and little. But for some reason, it hadn’t crossed my mind until today that I could apply Procmon to this problem.
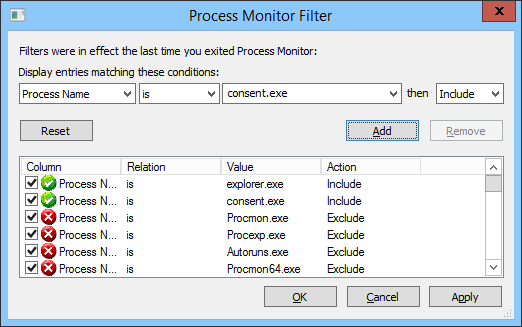
First, I configured Procmon to filter all events except for those generated by Explorer.exe and Consent.exe. I wasn’t sure if Consent.exe was involved in the problem (Consent.exe being the UAC elevation prompter), but it wouldn’t hurt to include it to start with. Note that all those Exclude filters are default filters setup by Procmon to exclude itself and its friends, removing that confusion from the logs.
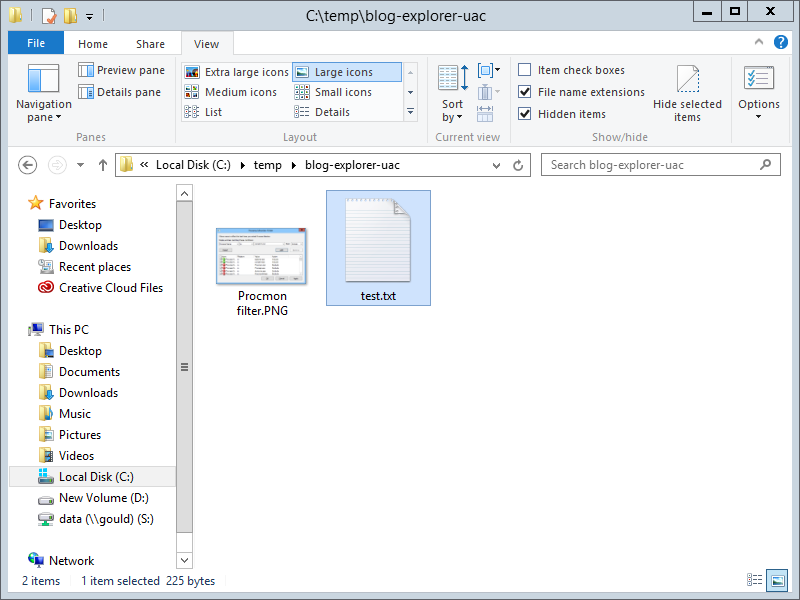
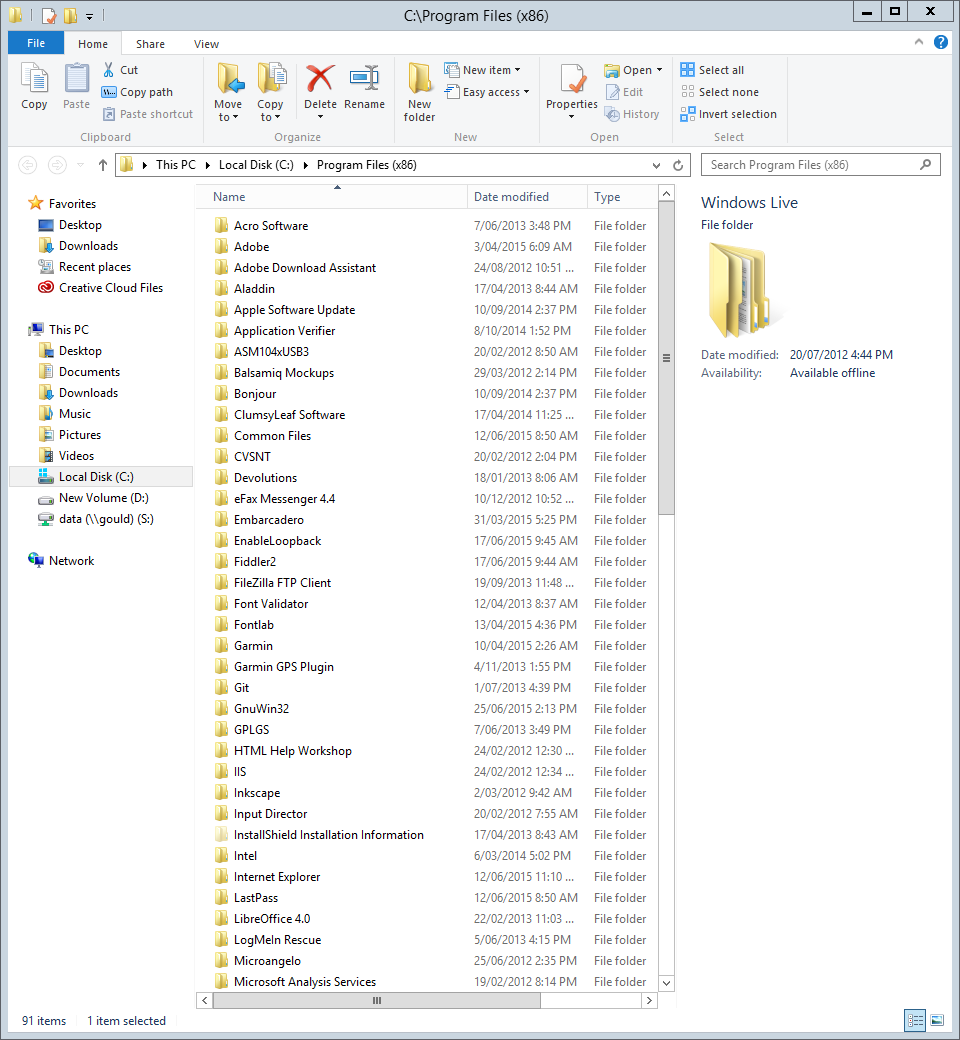
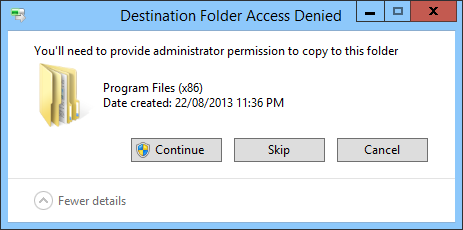
Then I went ahead and tried to copy a file into C:\Program Files (x86). It was just an innocent little text file, but Explorer of course acted like a Buckingham Palace Guard and silently and stolidly ignored its existence.
➔
I used the clipboard Ctrl+C and Ctrl+V to copy and paste (or attempt to paste) the file. I didn’t think the clipboard was at fault because all other UAC-required file operations also failed silently. I could have dragged and dropped, it would have had the same effect.
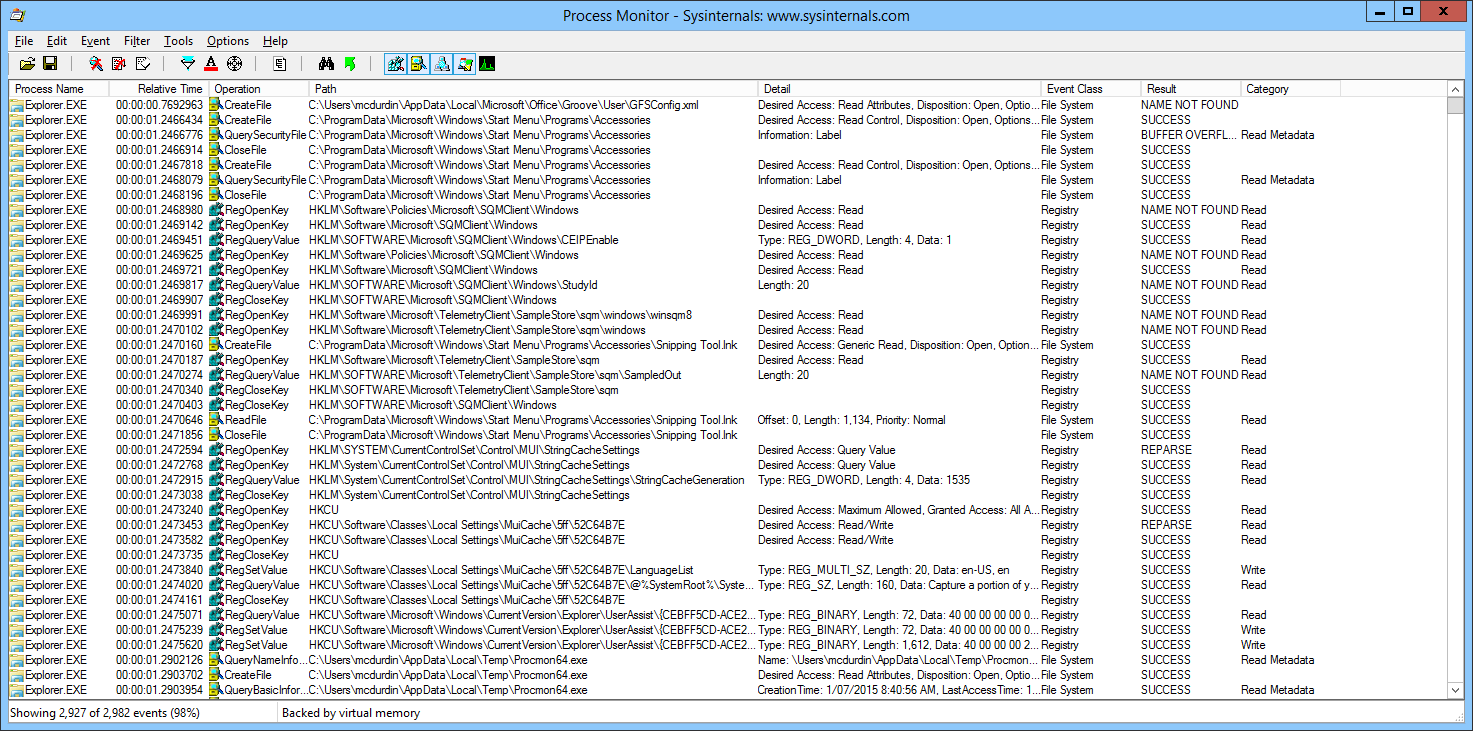
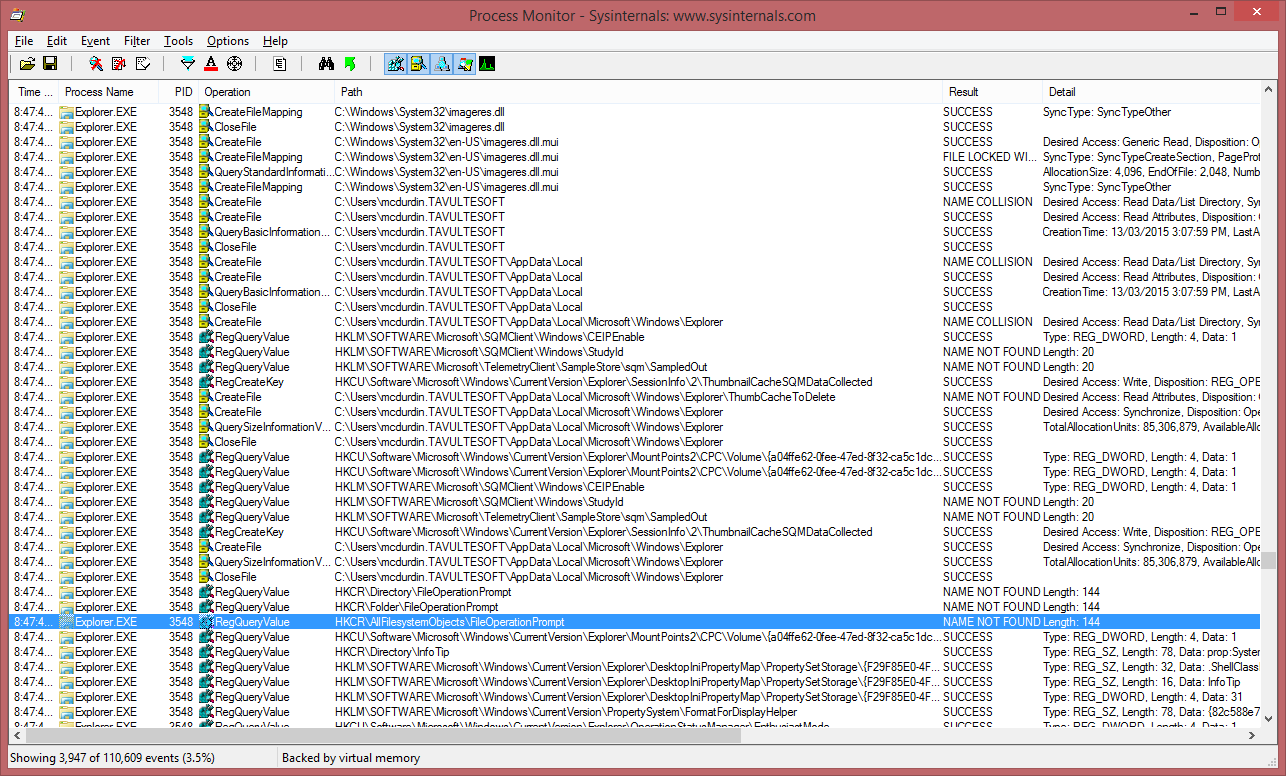
But now, with procmon, I had captured the communication that went on behind the scenes. All those secret coded winks and nose scratches that told Explorer to fob off any attempts to trigger a UAC prompt. Here’s what I was presented with in the Procmon log.
I searched for the name of my text file (test.txt), and used Procmon’s Highlight tool to highlight every reference to it in the Path column. This made it easy to spot nearby interactions that may have been related, even if they didn’t directly reference the test.txt file itself. You can see below two of the highlighted test.txt lines.
Because there was a lot going on, I filtered out a lot of Operations that I thought were not relevant, such as CloseFile, RegCloseKey, RegQueryKey, ReadFile and WriteFile, among others. This reduced the log considerably and made it easier to spot differences (my screen capture below shows the filtering after it was reset, however — I forgot to capture the filtered trace, sorry).
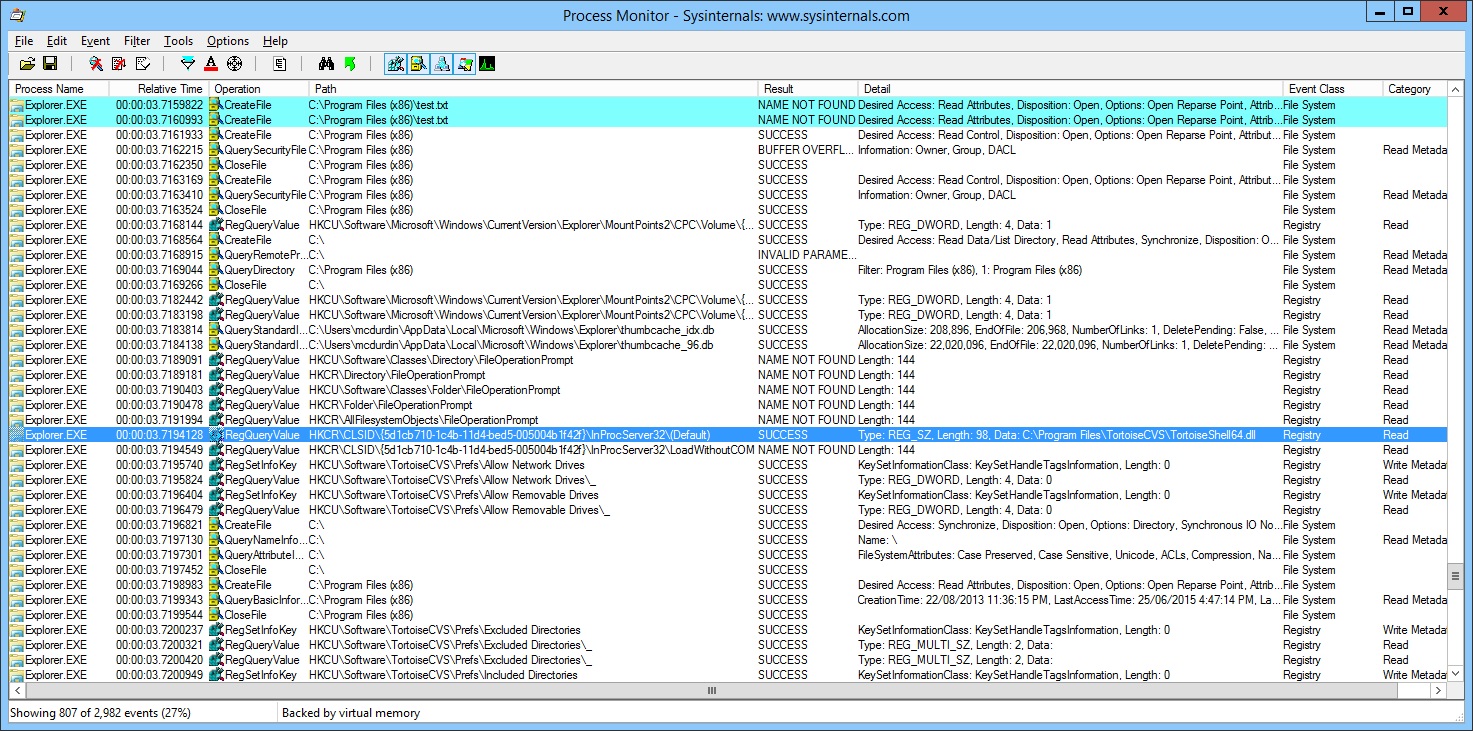
I decided to also capture a trace on a machine where UAC prompting worked. I then compared the two logs. After scrolling back and forth around the many references to test.txt, I saw that on my dev machine, there was an additional interaction, right before the point where the prompt dialog was presented:
That’s right, I had a program called TortoiseCVS installed on this machine which hooked into Explorer in a variety of ways. After the FileOperationPrompt references on my second machine, there was no reference to TortoiseCVS. Here’s what it looked like on the other machine:
That was the only visible difference of significance in the logs.
Now for those of you who just knee-jerked into “why on earth are you using CVS?!?”, calm down! This is a story, and I’m telling the story.
I decided that I didn’t really need TortoiseCVS installed and decided to try uninstalling it.
Sadly, uninstalling it required a reboot, no doubt to remove its old fashioned hooks into Explorer.
After the reboot, I tried to copy my innocent little text file again.
Success! I was now presented with the prompt I wanted!
Another case closed thanks to SysInternals Suite and Mark Russinovich!
We recently ran into a nasty little bug in the Delphi XE2 compiler, that arises with a complex set of conditions:
A record with a string property that has a get function;
A call to this getter that has a constant string appended to the result;
This result passed directly to another arbitrary function.
When these conditions are met (see code below for examples), the compiler generates code that crashes.
Reproducing the bug
The following program is enough to reproduce the bug.
program ustrcatbug;

type
  TWrappedString = record
  private
    FValue: string;
    function GetValue: string;
  public
    property Value: string read GetValue;
  end;

{ TWrappedString }

function TWrappedString.GetValue: string;
begin
  Result := FValue;
end;

function GetWrappedString: TWrappedString;
begin
  Result.FValue := 'Something';
end;

begin
  writeln(GetWrappedString.Value + ' Else');
end.
Looking at the last line of code from that sample in the disassembler, we see the following code:
The problem is that eax is not preserved through function calls with Delphi’s default register calling convention. And, as _UStrCat is a procedure, we can make no assumptions about the return value (which is passed in eax):
Upgrade to Delphi XE7 – this problem appears to be resolved, though I could not find a QC or RSP report relating to the bug when I searched. Moving to XE7 is not an option for us in the short term: too many code changes, too many unknowns.
Don’t use properties in records. This means changing code to call functions instead: no big deal for the Get, but annoying for the Set half of the function pair.
Patch around the problem by modifying UStrCat to return the address of the Dest parameter.
In the end, I wrote option (3) but we went with option (2) in our code base.
Because UStrCat is implemented in System.pas, it’s difficult to build your own version of the unit. One way to skin the option 3 UStrCat is to copy the implementation of UStrCat and its dependencies (a bunch of memory and string manipulation functions), and monkeypatch at runtime.
In the copied functions, we need to preserve eax through the function calls. This results in the addition of 4 lines of assembly to the UStrCat and UStrAsg functions, pushing the eax register onto the stack and popping it before exit. I haven’t reproduced the code here because the original is copyrighted to Embarcadero, but here are the changes required:
In UStrCat, Add push eax just after the conditional jump to UStrAsg, and pop eax just before the ret instruction.
In UStrAsg, wrap the call to FreeMem with a push eax and pop eax.
The patch function is also pretty straightforward:
procedure MonkeyPatch(OldProc, NewProc: PBYTE);
var
  pBase, p: PBYTE;
  oldProtect: Cardinal;
begin
  p := OldProc;
  pBase := p;

  // Allow writes to this small bit of the code section
  VirtualProtect(pBase, 5, PAGE_EXECUTE_WRITECOPY, oldProtect);

  // First write the long jmp instruction.
  p := pBase;
  p^ := $E9;  // long jmp opcode
  Inc(p);
  PDWord(p)^ := DWORD(NewProc) - DWORD(p) - 4;  // address to jump to, relative to EIP

  // Finally, protect that memory again now that we are finished with it
  VirtualProtect(pBase, 5, oldProtect, oldProtect);
end;

function GetUStrCatAddr: Pointer; assembler;
asm
  lea  eax,System.@UStrCat
end;

initialization
  MonkeyPatch(GetUStrCatAddr, @_UStrCatMonkey);
end.
This solution does give me the heebie jeebies, because we are patching the symptoms of the problem as we’ve seen them arise, without being able to either understand or address the root cause within the compiler. It’s not really possible to guarantee that there won’t be some other code path that causes this solution to come unstuck without really digging deep into the compiler’s code generation.
As noted, this problem appears to be resolved in Delphi XE5 or possibly earlier; however it is unclear if the root cause of the problem has been addressed, or we just got lucky. The issue has been reported as RSP-10255.
I was trying to debug a web application today, which is running in an Internet Explorer MSHTML window embedded in a thick client application. Weirdly, the app would fail, silently, without any script errors, on the sixth refresh — pressing F5 six times in a row would crash it each and every time. Ctrl+F5 or F5, either would do it.
I was going slightly mad trying to trace this, with no obvious solutions. Finally I loaded the process up in Windbg, not expecting much, and found that three (handled) C++ exceptions were thrown for each of the first 6 loads (initial load, + 5 refreshes):
(958.17ac): C++ EH exception - code e06d7363 (first chance)
(958.17ac): C++ EH exception - code e06d7363 (first chance)
(958.17ac): C++ EH exception - code e06d7363 (first chance)
However, on the sixth refresh, this exception was happening four times:
(958.17ac): C++ EH exception - code e06d7363 (first chance)
(958.17ac): C++ EH exception - code e06d7363 (first chance)
(958.17ac): C++ EH exception - code e06d7363 (first chance)
(958.17ac): C++ EH exception - code e06d7363 (first chance)
This gave me something to look at! At the very least there was an observable difference between the refreshes within the debugger. A little more spelunking revealed that the very last exception thrown was the relevant one, and it returned the following trace (snipped):
So now I knew that somewhere deep in my Javascript code there was something happening that was bad. Okay… I guess that helps, maybe?
But then, after some more googling, I discovered the following blog post, published a mere 9 days ago: Finally… JavaScript source line info in a dump. Magic! (In fact, I’m just writing this blog post for my future self, so I remember where to find this info in the future.)
After following the specific incantations outlined within that post, I was able to get the exact line of Javascript that was causing my weird error. All of a sudden, things made sense.
0:000> k
ChildEBP RetAddr
00186520 76bd22b4 KERNELBASE!RaiseException+0x48
00186558 5900775d msvcrt!_CxxThrowException+0x59
00186588 590076a3 jscript9!Js::JavascriptExceptionOperators::ThrowExceptionObjectInternal+0xb7
001865b8 5901503d jscript9!Js::JavascriptExceptionOperators::Throw+0x77
00186604 6365e79b jscript9!CJavascriptOperations::ThrowException+0x9c
0018662c 63e609aa mshtml!CFastDOM::ThrowDOMError+0x70
00186660 58f1f9a3 mshtml!CFastDOM::CWebSocket::DefaultEntryPoint+0xe2
001866c8 58f29994 jscript9!Js::JavascriptExternalFunction::ExternalFunctionThunk+0x165
00186724 58f2988c jscript9!Js::JavascriptFunction::CallAsConstructor+0xc7
00186744 58f29a4a jscript9!Js::InterpreterStackFrame::NewScObject_Helper+0x39
00186760 58f29a7a jscript9!Js::InterpreterStackFrame::ProfiledNewScObject_Helper+0x53
00186780 58f29aa9 jscript9!Js::InterpreterStackFrame::OP_NewScObject_Impl<Js::OpLayoutCallI_OneByte,1>+0x24
00186b58 58f26510 jscript9!Js::InterpreterStackFrame::Process+0x402b
00186d6c 14ea1ae1 jscript9!Js::InterpreterStackFrame::InterpreterThunk<1>+0x1e8
WARNING: Frame IP not in any known module. Following frames may be wrong.
00186d78 58faa407 js!Anonymous function [http://marcdev2010:4131/app/main/main-controller.js @ 251,7]
00186e70 15511455 jscript9!Js::JavascriptFunction::EntryApply+0x267
00186ed8 58f268e6 js!d [http://marcdev2010:4131/lib/angular/angular.min.js @ 34,479]
001872c8 58f26510 jscript9!Js::InterpreterStackFrame::Process+0x899
001873f4 14ea0681 jscript9!Js::InterpreterStackFrame::InterpreterThunk<1>+0x1e8
00187400 58f268e6 js!instantiate [http://marcdev2010:4131/lib/angular/angular.min.js @ 35,101]
001877e8 58f26510 jscript9!Js::InterpreterStackFrame::Process+0x899
00187944 14ea1b41 jscript9!Js::InterpreterStackFrame::InterpreterThunk<1>+0x1e8
00187950 58f268e6 js!Anonymous function [http://marcdev2010:4131/lib/angular/angular.min.js @ 67,280]
00187d38 58f26510 jscript9!Js::InterpreterStackFrame::Process+0x899
00187e74 14ea1c21 jscript9!Js::InterpreterStackFrame::InterpreterThunk<1>+0x1e8
...
When I looked at the line in question, line 251 of main-controller.js, I found:
// TODO: We need to handle the web socket connection going down -- it really should be wrappered
//  try {
      $scope.watcher = new WebSocket("ws://"+location.host+"/");
//  } catch(e) {
//    $scope.watcher = null;
//  }

    $scope.$on('$destroy', function() {
      if($scope.watcher) {
        $scope.watcher.close();
        $scope.watcher = null;
      }
    });
It turns out that if I press F5, or call browser.navigate from the container app, the $destroy event was never called, and what’s worse, MSHTML wasn’t shutting down the web socket, either. And by default, Internet Explorer has a maximum of six concurrent WebSocket connections. So six page loads and we’re done. The connection error is not triggering a script error in the MSHTML host, sadly, which is why it was so hard to track down.
Yeah, if I had already written the error handling for the WebSocket connection in the JavaScript code, this issue wouldn’t have been so hard to trace. But at least I’ve learned a useful new debugging technique!
Speculation and further investigation:
I’m still working on why the web socket is staying open between page loads when embedded. It’s not straightforward, and while onbeforeunload is a workaround that, well, works, I hate workarounds when I don’t have a clear answer as to why they are needed.
It is possible that there is a circular reference leak or similar, but I did kinda think MS had sorted most of those with recent releases of IE.
This problem is only reproducible within the MSHTML embedded browser, and not within Internet Explorer itself. Changing $scope.watcher to window.watcher made no difference.
TWebBrowser (Delphi) and TEmbeddedWB (Delphi) both exhibited the same symptoms.
A far simpler document with a web socket call did not cause the problem.
Updated a few minutes later:
Yes, I have found the cause. It’s a classic Internet Explorer leak: a function within a closure that references the DOM. Simplified, it looks something like:
  window.addEventListener( "load", function(event) {
    var aa = document.getElementById('aa');
    var watcher = new WebSocket("ws://"+location.host+"/");
    watcher.onmessage = function() {
      aa.innerHTML = 'message received';
    }
    aa.innerHTML = 'WebSocket started';
  }, false);
This will persist the connection between page loads, and quickly eat up your available WebSocket connections. But it still only happens in the embedded web browser. Why that is, I am still exploring.
Updated 30 Nov 2015:
The reason this happens only in the embedded web browser is that by default, the embedded web browser runs in an emulation mode for IE7. Even with the X-UA-Compatible meta tag, you still need to add your executable to the FEATURE_BROWSER_EMULATION registry key.
But I’m not here to talk about the record — I am more interested in the steps Windows XP users will take to mitigate the flaws, because Microsoft are not patching any of these vulnerabilities for Windows XP! Some people I’ve talked to, from individuals up to enterprises, seem to have the idea that they’ll practice “Safe Computing” and be able to continue using Windows XP and avoid paying for an upgrade.
What do I mean by Safe Computing? Y’know, don’t open strange attachments, use an alternate web browser, view emails with images switched off, keep antivirus and malware protection software up to date, remove unused applications, disable unwanted features, firewalls, mail and web proxies, so on and so forth.
So let’s look at what the repercussions are of practicing Safe Computing in light of these disclosures.
The first mitigation you are going to take is, obviously, to stop using Internet Explorer. With this many holes, you are clearly not going to be able to use Internet Explorer at all. This means a loss of functionality, though: those Internet Explorer-optimised sites (I’m looking at you, just about every corporate intranet) often don’t even work with non-IE browsers. So if you have to use IE to view these ‘trusted’ sites, you must ensure you never click on an external link, or you will be exposed again. Doable, but certainly a hassle.
Okay, so you don’t use IE now. You use Firefox, or Chrome. But you’re still in trouble, because it turns out that the very next security bulletin announces that GDI+ and Uniscribe are both vulnerable as well, today. GDI+ is used to display images and render graphics in Windows, and Uniscribe is used by just about every application to draw text onto the screen, including all the major web browsers. The Uniscribe flaw relates to how it processes fonts. The GDI+ flaw relates to a specific metafile image format.
So, disable support for downloadable fonts in your browser, and disable those specific metafile image types in the Windows Registry. Yes, it can be done. Now you’ll be all good, right? You don’t need those fonts, or those rare image types, do you? You can still surf the web okay?
But you’ve lost functionality, which we might not value all that highly, but it’s still a trade-off you’ve had to make.
From today, every security flaw that is announced will force you to trade more functionality for security.
And this is my point. From today, and on into the future, every security flaw that is announced will force you to trade yet more functionality for security. Eventually, you will only be able to use Windows XP offline — it simply will not be possible to safely access Internet resources without your computer and your data being compromised. It’s going to get worse from here, folks. It is well and truly past time to upgrade.
I tell a lie. Only 21 of those 59 vulnerabilities impact IE8 on Windows XP. You're all good, forget I said anything. http://t.co/1fmrbIB6mU
One of the most irritating server configuration issues I’ve run across recently emerged when adding global MIME type mappings to Microsoft Internet Information Services 7 — part of Windows Server 2008 R2.
Basically, if you have a MIME type mapping in a domain or path, and later add a mapping for the same file extension at a higher level in the configuration hierarchy, any subsequent requests to that domain or path will start returning HTTP 500 server errors.
You will not see any indication of conflicts, when you change the higher level MIME type mappings, and you typically only discover the error when a user complains that a specific page or site is down.
When you check your logs, you’ll see an error similar to the following:
\\?\C:\Websites\xxx\www\web.config ( 58) :Cannot add duplicate collection
    entry of type 'mimeMap' with unique key attribute
    'fileExtension' set to '.woff'
Furthermore, if you try and view the MIME types in the path or domain that is faulting within IIS Manager, you will receive the same error and will not be able to either view or address the problem (e.g. by removing the MIME type at that level, which would be the logical way to address the problem). The only way to address the problem in the UI view is to remove the global MIME mapping that is conflicting — or manually edit the web.config file at the lower level.
Not very nice — especially on shared hosts where you may not control the global settings!
I was preparing a new git repository today for a website, on my Windows machine, and moving a bunch of existing files over for addition. When I ran git add ., I ran into a weird error:
C:\tavultesoft\website\help.keyman.com> git add .
fatal: unable to stat 'desktop/docs/desktop_images/usage-none.PNG': No such file or directory
How could a file be there — and not there? I fired up Explorer to find the file and there it was, looked fine. I’d just copied there, so of course it was there!
For a moment, I scratched my head, trying to figure out what could be wrong. The file looked fine. It was in alphabetical order, so it seemed that the letters were of the correct script.
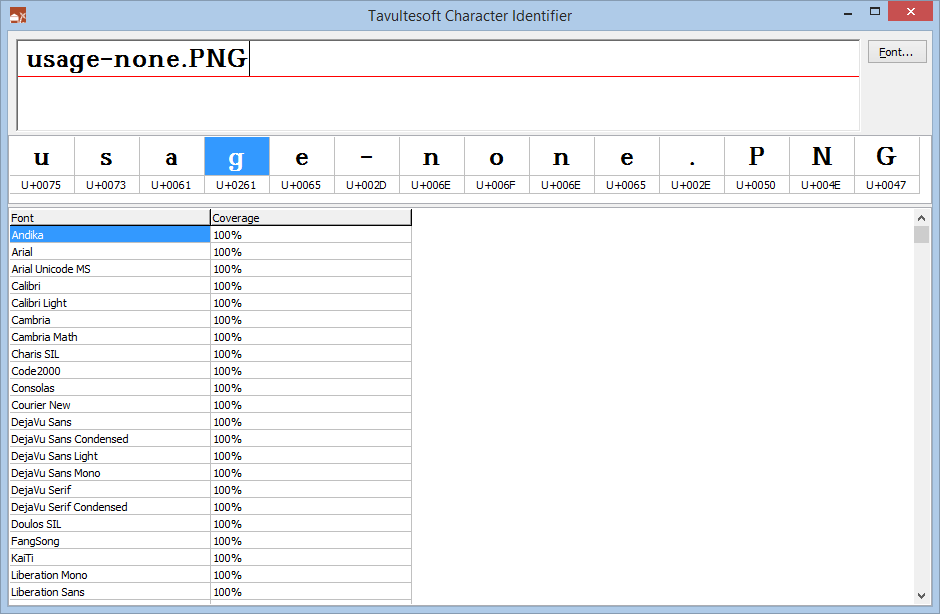
Being merely a bear of little brain, it took me some time to realise that I could just examine the character codepoints in the filename. When this finally sunk in, I quickly pulled out my handy charident tool and copied the filename text to the clipboard:
And pasted it into the Character Identifier:
With a quick scan of the Unicode code points, I quickly noticed that, sure enough, the letter ‘g‘ (highlighted) was not what was expected. It turns out that U+0261 is LATIN SMALL LETTER SCRIPT G, not quite what was anticipated (U+0067 LATIN SMALL LETTER G). And in the Windows 8.1 fonts used in Explorer, the ‘ɡ‘ and ‘g‘ characters look identical!
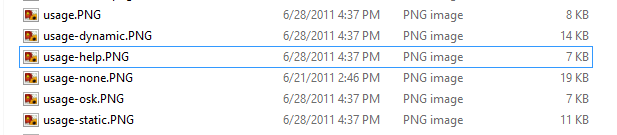
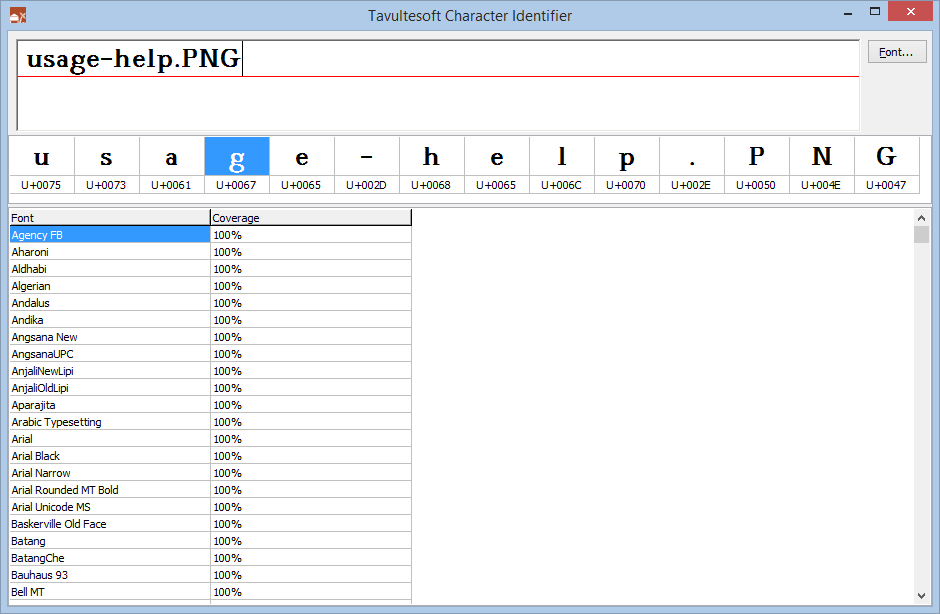
I checked some of the surrounding files as well. And looking at usage-help.PNG, I could see no problems with it:
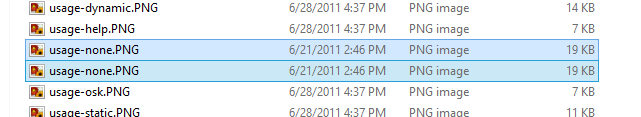
So why did git get so confused? OK, so git is a tool ported from the another world (“Linux”). It doesn’t quite grok Windows character set conventions for filenames. This is kinda what it saw when looking at the file (yes, that’s from a dir command):
But then somewhere in the process, a normalisation was done on the original filename, converting ɡ to g, and thus it found a mismatch, and reported a missing usage-none.PNG.
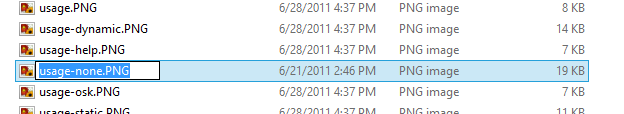
Windows does a similar compatibility normalisation and so confuses the user with seemingly sensible sort orders. But it doesn’t prevent you from creating two files with visually identical names, thus:
I’m sure there’s a security issue there somewhere…
Using WinDbg to debug Delphi processes can be both frustrating and rewarding. Frustrating, because even with the tools available to convert Delphi’s native .TDS symbol file format into .DBG or .PDB, we currently only get partial symbol information. But rewarding when you persist, because even though it may seem obscure and borderline irrational, once you get a handle on the way objects and Run Time Type Information (RTTI) are implemented with Delphi, you can accomplish a lot, quite easily.
For the post today, I’ve created a simple Delphi application which we will investigate in a couple of ways. If you want to follow along, you’ll need to build the application and convert the debug symbols generated by Delphi to .DBG format with map2dbg or tds2dbg. I’ll leave the finer details of that to you — it’s not very complicated. Actually, to save effort, I’ve uploaded both the source, and the debug symbols + dump + executable (24MB zip).
I’ve made reference to a few Delphi internal constants in this post. These are defined in System.pas, and I’m using the constants as defined for Delphi XE2. The values may be different in other versions of Delphi.
In the simple Delphi application, SpelunkSample, I will be debugging a simulated crash. You can choose to either attach WinDbg to the process while it is running, or to create a crash dump file using a tool such as procdump.exe and then working with the dump file. If you do choose to create a dump file, you should capture the full process memory dump, not just stack and thread information (use -ma flag with procdump.exe).
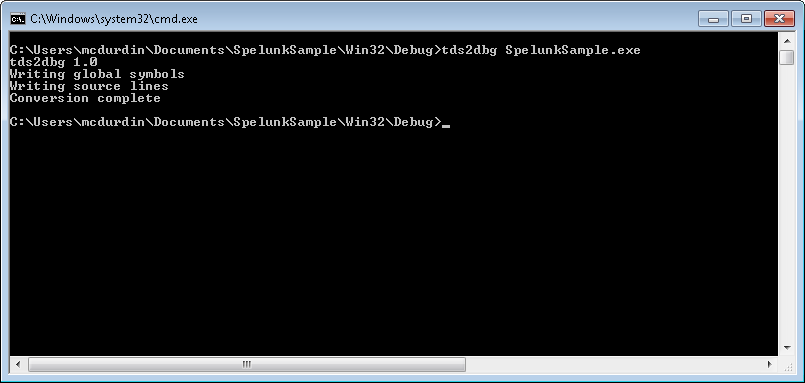
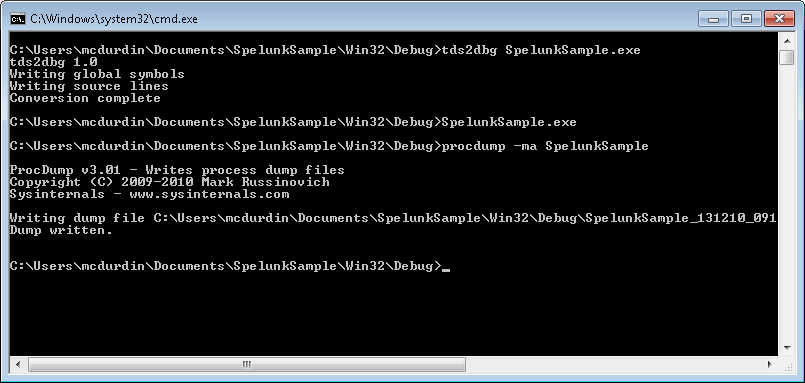
I’ll use procdump.exe. First, I use tds2dbg.exe to convert the symbols into a format that WinDbg groks: Convert Delphi debug symbols
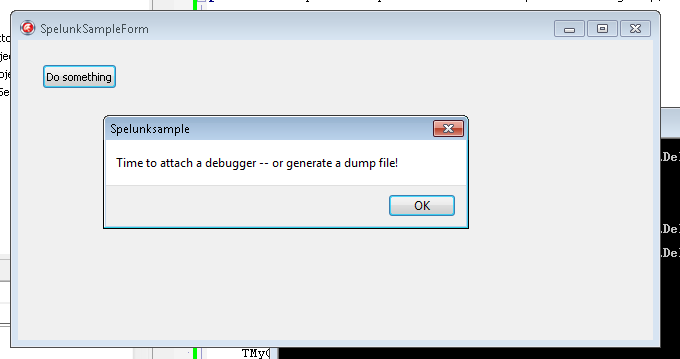
Then I just fire up the SpelunkSample process and click the “Do Something” button. Clicking “Do Something”
Next, I use procdump to capture a dump of the process as it stands. This generates a rather large file, given that this is not much more than a “Hello World” application, but don’t stress, we are not going to be reading the whole dump file in hex (only parts of it). Procdump to give us something to play with
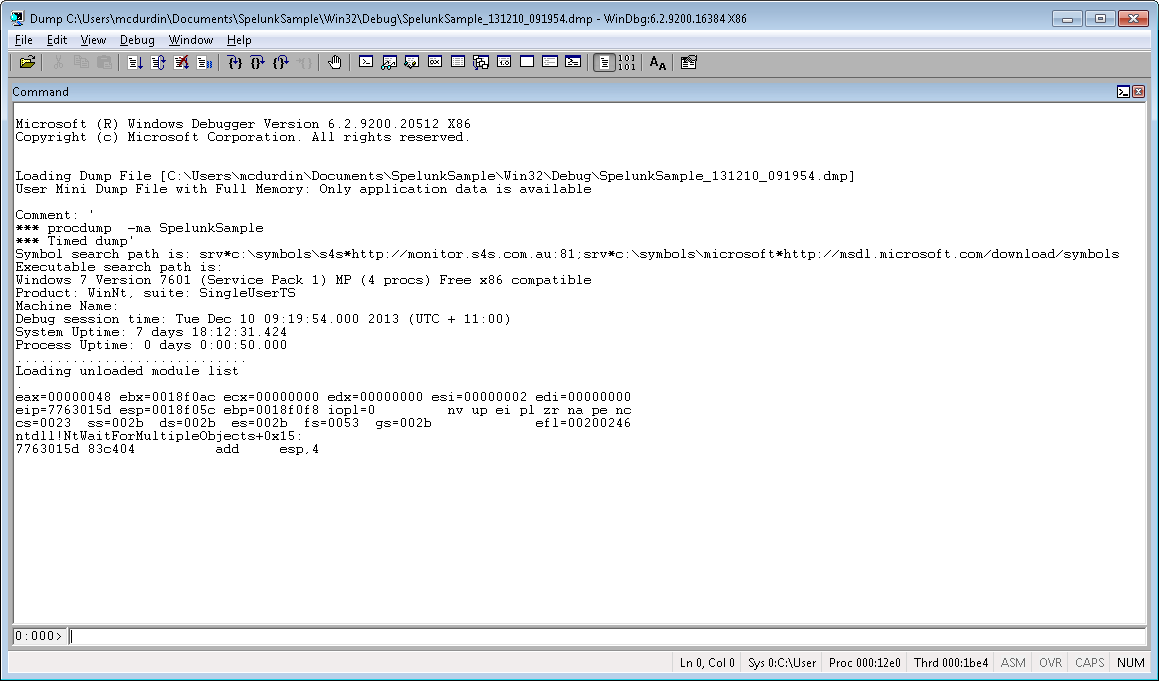
Time to load the dump file up in Windbg.
I want to understand what is going wrong with the process (actually, nothing is going wrong, but bear with me). I figure it’s important to know which forms are currently instantiated. This is conceptually easy enough to do: Delphi provides the TScreen class, which is instantiated as a global singleton accessible via the Screen variable in Vcl.Forms.pas. If we load this up, we can see a member variable FForms: TList, which contains references to all the forms “on the screen”.
But how to find this object in a 60 megabyte dump file? In fact, there are two good methods: use Delphi’s RTTI and track back; and use the global screen variable and track forward. I’ll examine them both, because they both come in handy in different situations.
Finding objects using Delphi’s RTTI
Using Delphi’s Run Time Type Information (RTTI), we can find the name of the class in memory and then track back from that. This information is in the process image, which is mapped into memory at a specific address (by default, 00400000 for Delphi apps, although you can change this in Linker options). So let’s find out where this is mapped:
Now we can search this memory for a specific ASCII string, the class name TScreen. When searching through memory, it’s important to be aware that this is just raw memory. So false positives are not uncommon. If you are unlucky, then the data you are searching for could be repeated many times through the dump, making this task virtually impossible. In practice, however, I’ve found that this rarely happens.
With that in mind, let’s do using the s -a command:
Whoa, that’s a lot of data. Looking at the results though, there are two distinct ranges of memory: 004F#### and 00A#####. Those in the 00A##### range are actually Delphi’s native debug symbols, mapped into memory. So I can ignore those. To keep myself sane, and make the debug console easier to review, I’ll rerun the search for a smaller range:
0:000> s -a 0400000 00a80000 "TScreen"
004f8f81  54 53 63 72 65 65 6e 36-00 90 5b 50 00 06 43 72  TScreen6..[P..Cr
004f9302  54 53 63 72 65 65 6e e4-8b 4f 00 f8 06 44 00 02  TScreen..O...D..
Now, these two references are close together, and I will tell you that the first one is the one we want. Generally speaking, the first one is in the class metadata, and the second one is not important today. Now that we have that "TScreen" string found in memory, we need to go back 1 byte. Why? Because "TScreen" is a Delphi ShortString, which is a string up to 255 bytes long, implemented as a length:byte followed by data (ANSI chars). And then we search for a pointer to that memory location with the s -d command:
Only one reference, nearby in memory, which is expected — the class metadata is generally stored nearby the class implementation. Now this is where it gets a little brain-bending. This pointer is stored in Delphi’s class metadata, as I said. But most this metadata is actually stored in memory before the class itself. Looking at System.pas, in Delphi XE2 we have the following metadata for x86:
Ignore that deprecated noise — it’s the constants that we want to know about. So the vmtClassName is at offset -56 (-38 hex). In other words, to find the class itself, we need to look 56 bytes ahead of the address of that pointer that we just found. That is, 004f8bac + 38h = 004f8be4. Now, if I use the dds (display words and symbols) command, we can see pointers to the implementation of each of the class’s member functions:
Huh. That’s interesting, but it’s a sidetrack; we can see TScreen.Create which suggests we are looking at the right thing. There’s a whole lot more buried in there but it’s not for this post. Let’s go back to where we were.
How do we take that class address and find instances of the class? I’m sure you can see where we are going. But here’s where things change slightly: we are looking in allocated memory now, not just the process image. So our search has to broaden. Rather than go into the complexities of memory allocation, I’m going to go brute force and look across a much larger range of memory, using the L? search parameter (which allows us to search more than 256MB of data at once):
Only two references. Why two and not one, given that we know that TScreen is a singleton? Well, because Delphi helpfully defines a vmtSelf metadata member, at offset -88 (and if we do the math, we see that 004f8be4 - 004f8b8c = 58h = 88d). So let’s look at the second one. That’s our TScreen instance in memory.
In this case, there was only one instance. But you can sometimes pickup objects that have been freed but where the memory has not been reused. There’s no hard and fast way (that I am aware of) of identifying these cases — but using the second method of finding a Delphi object, described below, can help to differentiate.
I’ll come back to how we use this object memory shortly. But first, here’s another way of getting to the same address.
Finding a Delphi object by variable or reference
As we don’t have full debug symbol information at this time, it can be difficult to find variables in memory. For global variables, however, we know that the location is fixed at compile time, and so we can use the disassembler in WinDbg to locate the address relatively simply. First, look in the source for a reference to the Screen global variable. I’ve found it in the FindGlobalComponent function (ironically, that function is doing programatically what we are doing via the long and labourious manual method):
function FindGlobalComponent(const Name: string): TComponent;
var
  I: Integer;
begin
  for I := 0 to Screen.FormCount - 1 do
  begin
    ...
So, disassemble the first few lines of the function. Depending on the conversion tool you used, the symbol format may vary (x spelunksample!*substring* can help in finding symbols).
The highlighted address there corresponds to the Screen variable. The initialization+0xb1ac rubbish suggests missing symbol information, because (a) it doesn’t make much sense to be pointing to the “initialization” code, and (b) the offset is so large. And in fact, that is the case, we don’t have symbols for global variables at this time (one day).
But because we know this, we also know that 00524300 is the address of the Screen variable. The variable, which is a pointer, not the object itself! But because it’s a pointer, it’s easy to get to what it’s pointing to!
0:000> dd 00524300 L1
00524300  0247b370
Look familiar? Yep, it’s the same address as we found the RTTI way, and somewhat more quickly too. But now on to finding the list of forms!
Examining object members
Let’s dump that TScreen instance out and annotate its members. The symbols below I’ve manually added to the data, by looking at the implementation of TComponent and TScreen. I’ve also deleted some misleading annotations that Windbg added.
How did I map that? It’s not that hard — just look at the class definitions in the Delphi source. You do need to watch out for two things: packing, and padding. x86 processors expect variables to be aligned on a boundary of their size, so a 4 byte DWORD will be aligned on a 4 byte boundary. Conversely, a boolean only takes a byte of memory, and multiple booleans can be packed into a single DWORD. Delphi does not do any ‘intelligent’ reordering of object members (which makes life a lot simpler), so this means we can just map pretty much one-to-one. The TComponent object has the following member variables (TPersistent and TObject don’t have any member variables):
Let’s look at 02489da8, the FForms TList object. The first member variable of TList is FList: TPointerList. Knowing what we do about the object structure, we can:
It can be helpful to do a sanity check here and make sure that we haven’t gone down the wrong rabbit hole. Let’s check that this is actually a TList (poi deferences a pointer, but you should be able to figure the rest out given the discussion above):
0:000> da poi(004369e8-38)+1
00436b19  "TList'"
And yes, it is a TList, so we haven’t dereferenced the wrong pointer. All too easy to do in the dark cave that is assembly-language debugging. Back to the lead. We can see from the definition of TList:
Yes, it’s our form! But what is with that poi poi poi? Well, I could have dug down each layer one step at a time, but this is a shortcut, in one swell foop dereferencing the variable, first to the object, then dereferencing to the class, then back 38h bytes and dereferencing to the class name, and plus one byte for that ShortString hiccup. Saves time, and once familiar you can turn it into a WinDbg macro. But it’s helpful to be familiar with the structure first!
Your challenge
Your challenge now is to list each of the TMyObject instances currently allocated. I’ve added a little spice: one of them has been freed but some of the data may still be in the dump. So you may find it is not enough to just use RTTI to find the data — recall that the search may find false positives and freed instances. You should find that searching for RTTI and also disassembling functions that refer to member variables in the form are useful. Good luck!
Hint: If you are struggling to find member variable offsets to find the list, the following three lines of code from FormCreate may help (edx ends up pointing to the form instance):
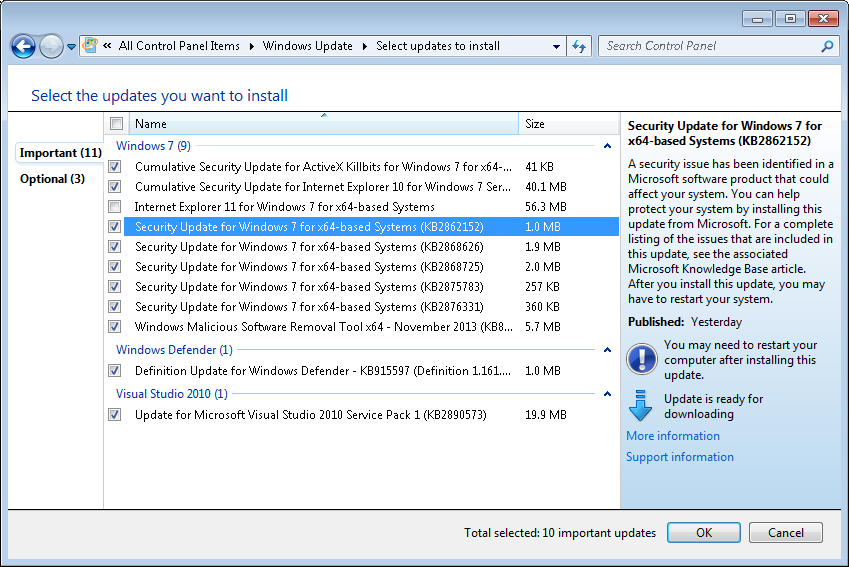
Windows Updates have improved dramatically over the last few years. With Windows 7, the integrated updates install smoothly and without much fuss (apart from the occasional EULA or Internet Explorer Upgrade to throw a spanner in the works).
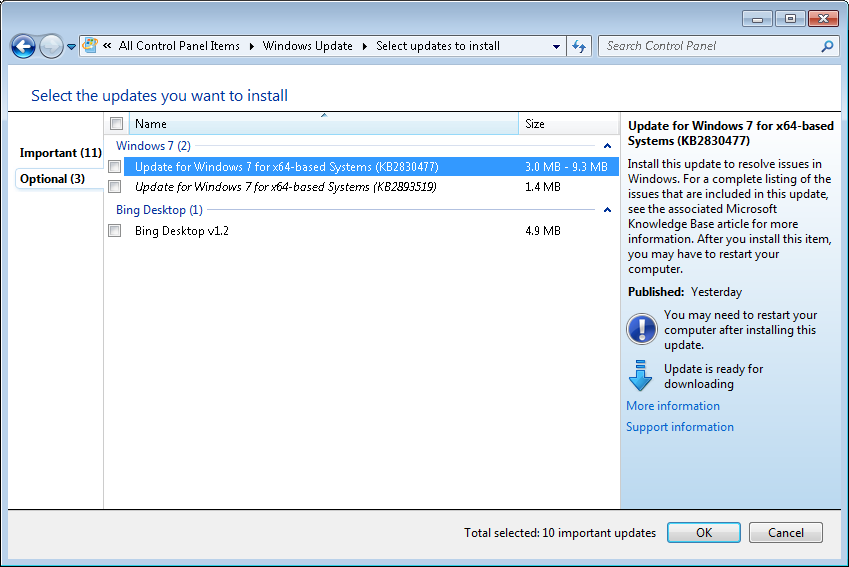
There’s just one thing. In general, the update titles are useless. Completely useless. “Security Update for Windows 7”? Why else would I be running Windows Update?
Furthermore, the detailed description is also useless — it doesn’t actually provide any details! It’s even more ambiguous than the title! “A security issue has been identified in a Microsoft software product that could affect your system.”
Let’s look at what’s wrong with “Update for Windows 7 for x64-based Systems (KB2830477)”:
It doesn’t tell us what the update actually provides
We already know it’s for Windows 7 — that’s in the group title.
We don’t need to know it’s for x64-based Systems — Windows Update won’t serve us updates for the wrong system type
We couldn’t we see “Update for RemoteApp and Desktop Connections features is available for Windows (KB2830477)”, instead? So which sleeve did I pull that descriptive and useful title from?
Well, the thing is, Microsoft already do know exactly what the update is providing. They have even taken the time to write a succinct title for the update: it’s the title of the Knowledge Base article associated with the update, and it’s even linked to from the update. For example, instead of “Update for Windows 7 (KB2852386)”, we could have “Update: Disk Cleanup Wizard addon lets users delete outdated Windows updates on Windows 7 SP1 (KB2852386)”
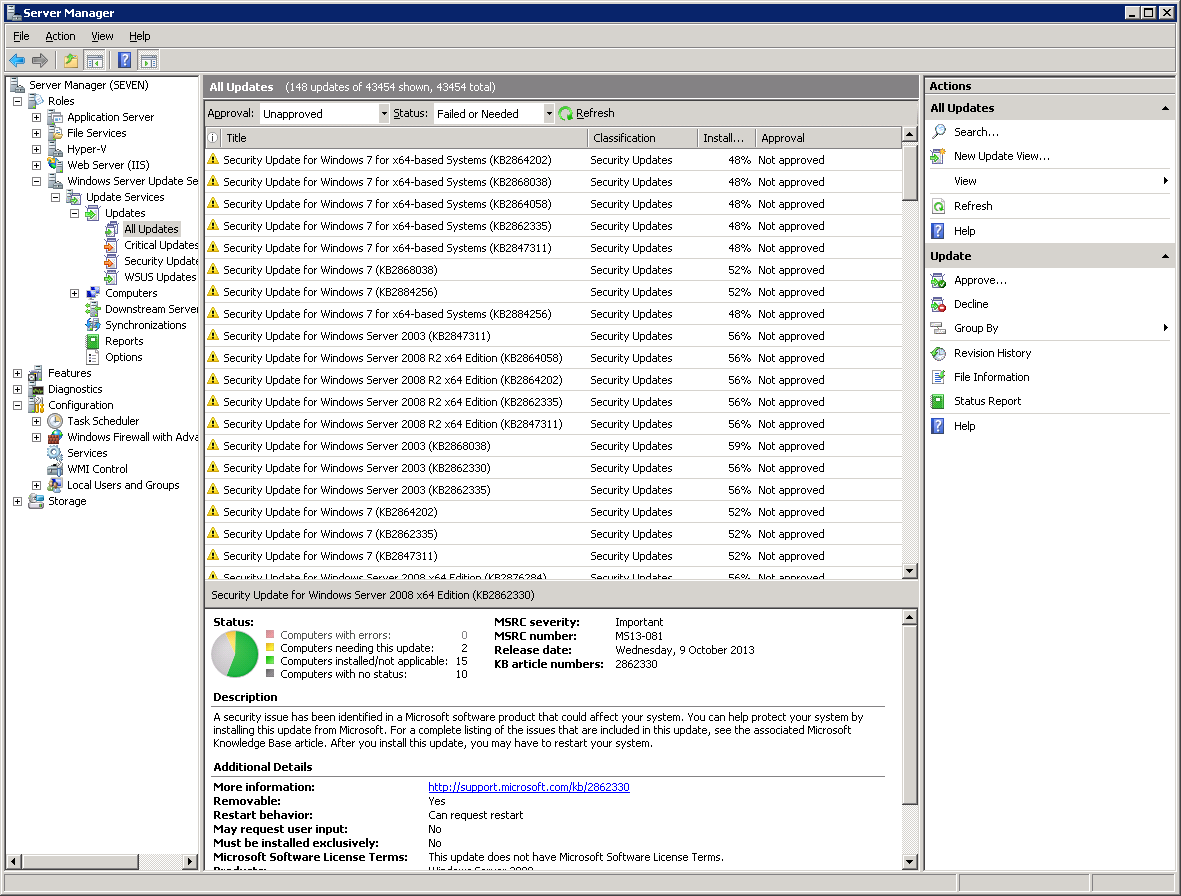
Now it’s even worse when using WSUS — you now have to trawl through hundreds of nearly identically titled updates, with only a KB article number to differentiate. So easy to accidentally approve the wrong update. Why, Microsoft, why? Is it so you don’t scare consumers who don’t understand what the update provides? They just press the big “Automatic Updates” button anyway!
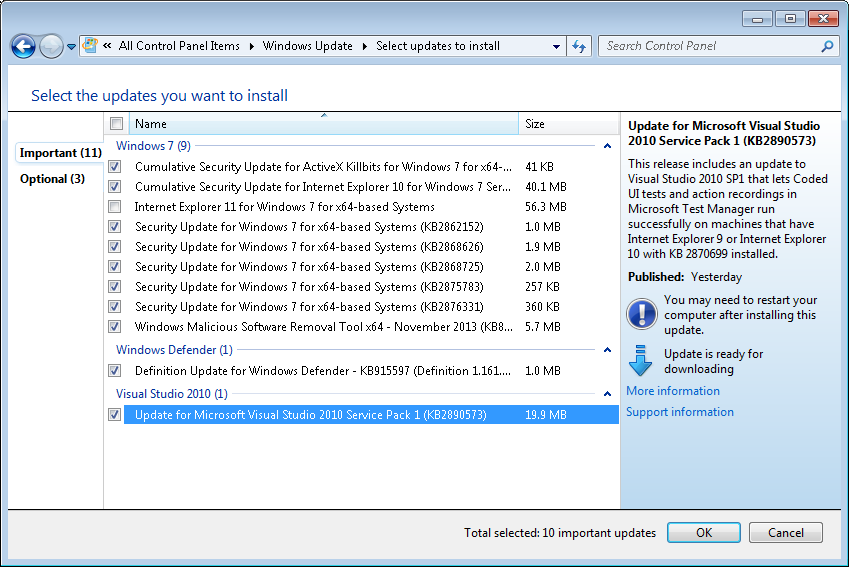
Admittedly, Microsoft have taken a big step in the right direction with Visual Studio updates: the description for Visual Studio updates generally gives you some information about what is being updated:
But even that could be improved. We’ve got a lot of repeated information: “Visual Studio 2010” is referenced 4 times: in the group title, in the update title, in the update title in the preview pane, and in the description of the update, again in the preview pane! Surely we don’t need to know that 4 times! And why don’t we go with a title of “Update fixes coded UI test issues for Visual Studio 2010 SP1 in IE9 or IE10 when KB 2870699 is installed (KB2890573)”. Sure it’s a little bit long, but it’s better than “Update for Microsoft Visual Studio 2010 Service Pack 1 (KB2890573)”.
So in conclusion, may I ask you, Microsoft, please, fix these update titles? Just start giving us titles that mean something? And if you are feeling particularly generous, you could even update the description of the update to add more meaning, not less!