A customer reported a problem with starting our application today. The error reported by our application was strange and was not one we’d encountered before:
Exception 'Exception' in module _________.exe at 004904CB
Unable to hook API functions for print preview [-1,-1,-1,0,0,0,0]
In effect the error told us that 4 out of 7 API hooks failed. I was called upon to try and diagnose the issue.
Initially I looked for a 3rd party application that could be hooking the calls in question (RegisterClassA, RegisterClassW, RegisterClassExA, RegisterClassExW). But there were no unusual applications running according to Process Explorer, and no unexpected DLLs in memory in the process. After disabling the antivirus in case that was causing the problem, and running both RootkitRevealer and Procmon with no clear outcomes, I decided I’d need to go deeper.
Time to break out windbg. I started our process and looked at the disassembly for one of the functions that failed to hook. Here’s what I saw:
0:000> u user32!registerclassexw
user32!RegisterClassExW:
7e41af7f 8bff            mov     edi,edi
7e41af81 55              push    ebp
7e41af82 8bec            mov     ebp,esp
7e41af84 8b4508          mov     eax,dword ptr [ebp+8]
7e41af87 833830          cmp     dword ptr [eax],30h
7e41af8a 0f850be70200    jne     user32!RegisterClassExW+0xd (7e44969b)
7e41af90 6800010000      push    100h
7e41af95 6a00            push    0
That’s pretty normal, the usual mov edi,edi that most Windows API calls start with, and what we were expecting. So I continued execution until the error occurred, and took another look at that point.
0:000> u user32!registerclassexw
user32!RegisterClassExW:
7e41af7f e9cc93d281      jmp     00144350
7e41af84 8b4508          mov     eax,dword ptr [ebp+8]
7e41af87 833830          cmp     dword ptr [eax],30h
7e41af8a 0f850be70200    jne     user32!RegisterClassExW+0xd (7e44969b)
7e41af90 6800010000      push    100h
7e41af95 6a00            push    0
7e41af97 6a00            push    0
7e41af99 50              push    eax
Huh, that’s kinda different. Now we were jumping off into a very unexpected part of memory. A quick check of that address revealed that it was not mapped into the normal address space of any modules. I had a look at the code in question.
0:000> u 144350 L...
00144350 55              push    ebp
00144351 8bec            mov     ebp,esp
00144353 83ec30          sub     esp,30h
00144356 f605e029150004  test    byte ptr ds:[1529E0h],4   ; 001529e0
0014435d 56              push    esi
0014435e 8b7508          mov     esi,dword ptr [ebp+8]
00144361 7433            je      00144396
00144363 e8595bffff      call    00139ec1
00144368 84c0            test    al,al
0014436a 742a            je      00144396
0014436c 85f6            test    esi,esi
0014436e 7426            je      00144396
00144370 833e30          cmp     dword ptr [esi],30h
00144373 7521            jne     00144396
00144375 8b4608          mov     eax,dword ptr [esi+8]
00144378 e8fdfeffff      call    0014427a
0014437d 85c0            test    eax,eax
0014437f 7415            je      00144396
00144381 6a30            push    30h
00144383 56              push    esi
00144384 8d4dd0          lea     ecx,[ebp-30h]
00144387 51              push    ecx
00144388 e818010000      call    001444a5
0014438d 8945d8          mov     dword ptr [ebp-28h],eax
00144390 8d45d0          lea     eax,[ebp-30h]
00144393 50              push    eax
00144394 eb01            jmp     00144397
00144396 56              push    esi
00144397 ff1568141300    call    dword ptr ds:[131468h]   ; -> 02200126
0014439d 5e              pop     esi
0014439e c9              leave
0014439f c20400          ret     4
A bit hard to know what it was doing but there was a call at the bottom there that was worth a quick look.
02200126 8bff            mov     edi,edi
02200128 55              push    ebp
02200129 8bec            mov     ebp,esp
0220012b e954ae217c      jmp     user32!RegisterClassExW+0x5 (7e41af84)
Yep, as expected it was a jump back to the original API function, 5 bytes in. That looked like a hook library was being used because the callback to the original function was in a separate memory block. But no real info. But again, looking at the address space revealed it belonged to no known module.
0:000> !address 2200126
    02200000 : 02200000 - 00001000
                    Type     00020000 MEM_PRIVATE
                    Protect  00000040 PAGE_EXECUTE_READWRITE
                    State    00001000 MEM_COMMIT
                    Usage    RegionUsageIsVAD
At this stage, it was clear we were looking at malware, so I decided to look for some strings in the data area referenced earlier (in blue, above). Initially I found only strings pointing to Application Data and other uninteresting sources.
0:000> dd 1529e0
001529e0  00000000 02181ea0 0000001c 83f6f0a1
001529f0  00000000 00130000 7c800000 7c900000
00152a00  02200000 00000000 7c90d7fe 00000000
00152a10  0220000a 7c916a02 0000000c 00152a24
00152a20  00000000 00040001 00000000 00000000
00152a30  00000000 00000000 ffffffff 02181ee0
00152a40  003a0043 0044005c 0063006f 006d0075
00152a50  006e0065 00730074 00610020 0064006e
But eventually I struck gold:
0:000> dd
00152f5c  00000000 000006b0 00000000 004f0053
00152f6c  00540046 00410057 00450052 004d005c
00152f7c  00630069 006f0072 006f0073 00740066
00152f8c  0041005c 006b0067 00610065 00000064
00152f9c  00000000 00000000 00000000 00000000
00152fac  00000000 00000000 00000000 00000000
00152fbc  00000000 00000000 00000000 00000000
00152fcc  0019c110 ffffffff 00000000 00000000
This proved to be a suspicious registry key:
0:000> du 152f68
00152f68  "SOFTWARE\Microsoft\Agkead"
A quick glance at that registry key showed the following suspicious registry entries:
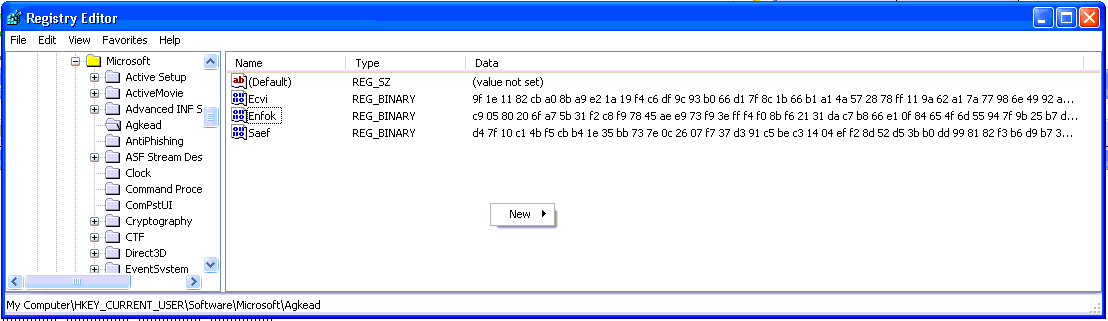
I picked up a few other interesting strings as well:
0:000> du 152fe8
00152fe8  "Global\{451EEC04-7C31-7A30-8C56-"
00153028  "BCE6C174342E}"
0:000> du 1527e0
001527e0  "Enfok"
The following string was also interesting:
0:000> du 1523d4
001523d4  "\Documents and Settings\Receptio"
00152414  "n_2.PGE\Application Data\Ewacg\o"
00152454  "xmo.hio"
While the folder existed, I was unable to see the file oxmo.hio. This, as well as the fact that I could not see any user mode activity doing the hooking of the functions in question, really suggested a rootkit which was doing some cloaking, rather than simple user-mode malware.
A reference to the string Agkead was on ThreatExpert.
But by now I was really only continuing out of interest, so I handed the machine in question back to the client, with the advice that they rebuild it — difficult to be sure that the machine is clean any other way. While it would have been fun to analyse the malware further, it’s not really my job 🙁