But I’m not here to talk about the record — I am more interested in the steps Windows XP users will take to mitigate the flaws, because Microsoft are not patching any of these vulnerabilities for Windows XP! Some people I’ve talked to, from individuals up to enterprises, seem to have the idea that they’ll practice “Safe Computing” and be able to continue using Windows XP and avoid paying for an upgrade.
What do I mean by Safe Computing? Y’know, don’t open strange attachments, use an alternate web browser, view emails with images switched off, keep antivirus and malware protection software up to date, remove unused applications, disable unwanted features, firewalls, mail and web proxies, so on and so forth.
So let’s look at what the repercussions are of practicing Safe Computing in light of these disclosures.
The first mitigation you are going to take is, obviously, to stop using Internet Explorer. With this many holes, you are clearly not going to be able to use Internet Explorer at all. This means a loss of functionality, though: those Internet Explorer-optimised sites (I’m looking at you, just about every corporate intranet) often don’t even work with non-IE browsers. So if you have to use IE to view these ‘trusted’ sites, you must ensure you never click on an external link, or you will be exposed again. Doable, but certainly a hassle.
Okay, so you don’t use IE now. You use Firefox, or Chrome. But you’re still in trouble, because it turns out that the very next security bulletin announces that GDI+ and Uniscribe are both vulnerable as well, today. GDI+ is used to display images and render graphics in Windows, and Uniscribe is used by just about every application to draw text onto the screen, including all the major web browsers. The Uniscribe flaw relates to how it processes fonts. The GDI+ flaw relates to a specific metafile image format.
So, disable support for downloadable fonts in your browser, and disable those specific metafile image types in the Windows Registry. Yes, it can be done. Now you’ll be all good, right? You don’t need those fonts, or those rare image types, do you? You can still surf the web okay?
But you’ve lost functionality, which we might not value all that highly, but it’s still a trade-off you’ve had to make.
From today, every security flaw that is announced will force you to trade more functionality for security.
And this is my point. From today, and on into the future, every security flaw that is announced will force you to trade yet more functionality for security. Eventually, you will only be able to use Windows XP offline — it simply will not be possible to safely access Internet resources without your computer and your data being compromised. It’s going to get worse from here, folks. It is well and truly past time to upgrade.
I tell a lie. Only 21 of those 59 vulnerabilities impact IE8 on Windows XP. You're all good, forget I said anything. http://t.co/1fmrbIB6mU
Like every other iOS developer, I have already downloaded and installed XCode 6 and the first beta 8.0 of iOS onto one of my test iDevices. And, like every other IOS developer, I immediately went to go and test one of my apps on the new build. And, unfortunately, as can be expected with a beta, I found a bug. I have dutifully filed a bug report via Apple’s bugreport.apple.com!
Given that bug reports are private, I have opted to make information public here because I have had many, many of my product users ask me about it: the bug first arose with iOS 7.1 and I had hoped that it had been addressed in 8.0. Most of my users are not technical enough to be able to navigate the bugreport.apple.com interface, so their only recourse is to complain to us!
Bug #1: Custom font profiles fail to register and work correctly after device restart
We have developed a number of custom font profiles for various languages, following the documentation on creating font profiles for iOS 7+ at https://developer.apple.com/library/ios/featuredarticles/iPhoneConfigurationProfileRef/iPhoneConfigurationProfileRef.pdf. Each of these profiles exhibits the same problem: after the font profile is installed, the specific language text usually displays in all apps, including Notes, Mail and more. However, as soon as the device is restarted, the font fails to display in any apps. In some cases, residual display of the font continues after the restart, but any edit to the text causes the display to revert to .notdef glyphs or similar.
Amharic text before the font profile is installed — square boxesAmharic text after the font profile is installed: now readable. But not for long.
Even before the device is restarted, font display is sometimes inconsistent. For example, if you shutdown mail and restart it, fonts will sometimes display correctly and sometimes incorrectly.
The samples given are using the language Amharic. The font profile can be installed through my Keyman app, available at http://keyman.com/iphone.
A sample of text in Amharic is ጤና ይስጥልን (U+1324 U+1293 U+0020 U+12ED U+1235 U+1325 U+120D U+1295). This text displays correctly when the font profile is first installed, in some situations, and always displayed correctly in iOS 7.0. The issue first arose in iOS 7.1 and has continued into the iOS 8.0 beta.
Bug #2: Touches on fixed elements in Safari are offset vertically
In Safari in iOS 8.0 beta 1, I have found that touching fixed elements often results in a touch which is 200-odd pixels north of the actual location I touch. No doubt plenty of people will report this one!
Updated 28 May 2014: Removed extraneous unit reference from AttributeValidation.pas. Sorry…
What problem was I trying to solve?
Recently, while using the Indy Internet components in Delphi XE2, I was struggling to track the thread contexts in which certain code paths ran, to ensure that resource contention and deadlocks were correctly catered for.
Indy components are reasonably robust, but use a multithreaded model which it turns out is difficult to get 100% correct. Component callbacks can occur on many different threads:
The thread that constructed the component
The VCL thread
The server listener thread
The connection’s thread
Some, e.g. exceptions, can occur on any thread
Disentangling this, especially when in conjunction with third party solutions that are based on Indy and may add several layers of indirection, quickly becomes an unenjoyable task.
I started adding thread validation assertions to each function to ensure that I was (a) understanding which thread context the function was actually running in, and (b) to ensure that I didn’t call the function in the wrong context myself. However, when browsing the code, it was still very difficult to get a big picture view of thread usage.
Introducing attributes
Enter attributes. Delphi 2010 introduced support for attributes in Win32, and a nice API to query them with extended Run Time Type Information (RTTI). This is nice, except for one thing: it’s difficult at runtime to find the RTTI associated with the current method.
In this unit, I have tried to tick a number of boxes:
Create a simple framework for extending runtime testing of classes with attributes
Use attributes to annotate methods, in this case about thread safety, to optimise self-documentation
Keep a single, consistent function call in each member method, to test any attributes associated with that method.
Sensible preprocessor use to enable and disable both the testing and full RTTI in one place.
One gotcha is that by default, RTTI for Delphi methods is only available for public and published member methods. This can be changed with the $RTTI compiler directive but you have to remember to do it in each unit! I have used a unit-based $I include in order to push the correct RTTI settings consistently.
I’ve made use of Delphi’s class helper model to give direct access to any object at compile time. This is a clean way of injecting this support into all classes which are touched by the RTTI, but does create larger executables. I believe this to be a worthwhile tradeoff.
Example code
The code sample below demonstrates how to use the attribute tests in a multi-threaded context. In this example, an assertion will be raised soon after cmdDoSomeHardWorkClick is called. Why is this? It happens because the HardWorkCallback function on the main thread is annotated with [MainThread] attribute, but it will be called from TSomeThread‘s thread context, not the main thread.
In order for the program run without an assertion, you could change the annotation of HardWorkCallback to [NotMainThread]. Making this serves as an immediate prompt that you should not be accessing VCL properties, because you are no longer running on the main thread. In fact, unless you can prove that the lifetime of the form will exceed that of TSomeThread, you shouldn’t even be referring to the form. The HardWorkCallback function here violates these principles by referring to the Handle property of TForm. However, because we can show that the form is destroyed after the thread exits, it’s safe to make the callback to the TAttrValForm object itself.
You can download the full source for this project from the link at the bottom of this post in order to compile it and run it yourself.
Exercise: How could you restructure this to make HardWorkCallback thread-safe? There’s more than one way to skin this cat.
unit AttrValSample;

interface

uses
  System.Classes,
  System.SyncObjs,
  System.SysUtils,
  System.Variants,
  Vcl.Controls,
  Vcl.Dialogs,
  Vcl.Forms,
  Vcl.Graphics,
  Vcl.StdCtrls,
  Winapi.Messages,
  Winapi.Windows,

  {$I AttributeValidation.inc};

type
  TSomeThread = class;

  TAttrValForm = class(TForm)
    cmdStartThread: TButton;
    cmdDoSomeHardWork: TButton;
    cmdStopThread: TButton;
    procedure cmdStartThreadClick(Sender: TObject);
    procedure FormDestroy(Sender: TObject);
    procedure cmdStopThreadClick(Sender: TObject);
    procedure cmdDoSomeHardWorkClick(Sender: TObject);
  private
    FThread: TSomeThread;
  public
    [MainThread] procedure HardWorkCallback;
  end;

  TSomeThread = class(TThread)
  private
    FOwner: TAttrValForm;
    FEvent: TEvent;
    [NotMainThread] procedure HardWork;
  protected
    [NotMainThread] procedure Execute; override;
  public
    [MainThread] constructor Create(AOwner: TAttrValForm);
    [MainThread] destructor Destroy; override;
    [MainThread] procedure DoSomeHardWork;
  end;

var
  AttrValForm: TAttrValForm;

implementation

{$R *.dfm}

procedure TAttrValForm.cmdStartThreadClick(Sender: TObject);
begin
  FThread := TSomeThread.Create(Self);

  cmdDoSomeHardWork.Enabled := True;
  cmdStopThread.Enabled := True;
  cmdStartThread.Enabled := False;
end;

procedure TAttrValForm.cmdDoSomeHardWorkClick(Sender: TObject);
begin
  FThread.DoSomeHardWork;
end;

procedure TAttrValForm.cmdStopThreadClick(Sender: TObject);
begin
  FreeAndNil(FThread);
  cmdDoSomeHardWork.Enabled := False;
  cmdStopThread.Enabled := False;
  cmdStartThread.Enabled := True;
end;

procedure TAttrValForm.FormDestroy(Sender: TObject);
begin
  FreeAndNil(FThread);
end;

procedure TAttrValForm.HardWorkCallback;
begin
  ValidateAttributes;
  SetWindowText(Handle, 'Hard work done');
end;

{ TSomeThread }

constructor TSomeThread.Create(AOwner: TAttrValForm);
begin
  ValidateAttributes;
  FEvent := TEvent.Create(nil, False, False, '');
  FOwner := AOwner;
  inherited Create(False);
end;

destructor TSomeThread.Destroy;
begin
  ValidateAttributes;
  if not Terminated then
  begin
    Terminate;
    FEvent.SetEvent;
    WaitFor;
  end;
  FreeAndNil(FEvent);
  inherited Destroy;
end;

procedure TSomeThread.DoSomeHardWork;
begin
  ValidateAttributes;
  FEvent.SetEvent;
end;

procedure TSomeThread.Execute;
begin
  ValidateAttributes;
  while not Terminated do
  begin
    if FEvent.WaitFor = wrSignaled then
      if not Terminated then
        HardWork;
  end;
end;

procedure TSomeThread.HardWork;
begin
  ValidateAttributes;
  FOwner.HardWorkCallback;
end;

end.
The AttributeValidation.inc file referenced in the uses clause above controls RTTI and debug settings, in one line. This pattern makes it easy to use the unit without forgetting to set the appropriate RTTI flags in one unit.
// Disable the following $DEFINE to remove all validation from the project
// You may want to do this with {$IFDEF DEBUG} ... {$ENDIF}
{$DEFINE ATTRIBUTE_DEBUG}

// Shouldn't need to touch anything below here
{$IFDEF ATTRIBUTE_DEBUG}
{$RTTI EXPLICIT METHODS([vcPrivate,vcProtected,vcPublic,vcPublished])}
{$ENDIF}

// This .inc file is also included from AttributeValidation.pas, so
// don't use it again in that context.
{$IFNDEF ATTRIBUTE_DEBUG_UNIT}
AttributeValidation
{$ENDIF}
Finally, the AttributeValidation.pas file itself contains the assembly stub to capture the return address for the caller, and the search through the RTTI for the appropriate method to test in each case. This will have a performance cost so should really only be present in Debug builds.
unit AttributeValidation;

interface

{$DEFINE ATTRIBUTE_DEBUG_UNIT}
{$I AttributeValidation.inc}

uses
  System.Rtti;

type
  // Base class for all validation attributes
  ValidationAttribute = class(TCustomAttribute)
    function Execute(Method: TRTTIMethod): Boolean; virtual;
  end;

  // Will log to the debug console whenever a deprecated
  // function is called
  DeprecatedAttribute = class(ValidationAttribute)
    function Execute(Method: TRTTIMethod): Boolean; override;
  end;

  // Base class for all thread-related attributes
  ThreadAttribute = class(ValidationAttribute);

  // This indicates that the procedure can be called from
  // any thread.  No test to pass, just a bare attribute
  ThreadSafeAttribute = class(ThreadAttribute);

  // This indicates that the procedure must only be called
  // in the context of the main thread
  MainThreadAttribute = class(ThreadAttribute)
    function Execute(Method: TRTTIMethod): Boolean; override;
  end;

  // This indicates that the procedure must only be called
  // in another thread context.
  NotMainThreadAttribute = class(ThreadAttribute)
    function Execute(Method: TRTTIMethod): Boolean; override;
  end;

  TAttributeValidation = class helper for TObject
{$IFDEF ATTRIBUTE_DEBUG}
  private
    procedure IntValidateAttributes(FReturnAddress: UIntPtr);
{$ENDIF}
  protected
    procedure ValidateAttributes;
  end;

implementation

uses
  Winapi.Windows,

  classes;

{ TAttributeValidation }

{
 Function:    TAttributeValidation.ValidateAttributes

 Description: Save the return address to an accessible variable
              on the stack.  We could do this with pure Delphi and
              some pointer jiggery-pokery, but this is cleaner.
}
{$IFNDEF ATTRIBUTE_DEBUG}
procedure TAttributeValidation.ValidateAttributes;
begin
end;
{$ELSE}
{$IFDEF CPUX64}
procedure TAttributeValidation.ValidateAttributes;
asm
  push rbp
  sub  rsp, $20
  mov  rbp, rsp
                          // rcx = param 1; will already be pointing to Self.
  mov  rdx, [rbp+$28]     // rdx = param 2; rbp+$28 is return address on stack
  call TAttributeValidation.IntValidateAttributes;

  lea  rsp, [rbp+$20]
  pop  rbp
end;
{$ELSE}
procedure TAttributeValidation.ValidateAttributes;
asm
                            // eax = Self
  mov edx, dword ptr [esp]  // edx = parameter 1
  call TAttributeValidation.IntValidateAttributes
end;
{$ENDIF}

{
 Function:    TAttributeValidation.IntValidateAttributes

 Description: Find the closest function to the return address,
              and test the attributes in that function.  Assumes
              that the closest function is the correct one, so
              if RTTI is missing then you'll be in a spot of
              bother.
}
procedure TAttributeValidation.IntValidateAttributes(FReturnAddress: UIntPtr);
var
  FRttiType: TRttiType;
  FClosestRttiMethod, FRttiMethod: TRTTIMethod;
  FAttribute: TCustomAttribute;
begin
  with TRttiContext.Create do
  try
    FRttiType := GetType(ClassType);
    if not Assigned(FRttiType) then Exit;

    FClosestRttiMethod := nil;

    // Find nearest function for the return address
    for FRttiMethod in FRttiType.GetMethods do
    begin
      if (UIntPtr(FRttiMethod.CodeAddress) <= FReturnAddress) then
      begin
        if not Assigned(FClosestRttiMethod) or
            (UIntPtr(FRttiMethod.CodeAddress) > UIntPtr(FClosestRttiMethod.CodeAddress)) then
          FClosestRttiMethod := FRttiMethod;
      end;
    end;

    // Check attributes for the function
    if Assigned(FClosestRttiMethod) then
    begin
      for FAttribute in FClosestRttiMethod.GetAttributes do
      begin
        if FAttribute is ValidationAttribute then
        begin
          if not (FAttribute as ValidationAttribute).Execute(FClosestRttiMethod) then
          begin
            Assert(False, 'Attribute '+FAttribute.ClassName+' did not validate on '+FClosestRttiMethod.Name);
          end;
        end;
      end;
    end;
  finally
    Free;
  end;
end;
{$ENDIF}

{ ValidationAttribute }

function ValidationAttribute.Execute(Method: TRTTIMethod): Boolean;
begin
  Result := True;
end;

{ MainThreadAttribute }

function MainThreadAttribute.Execute(Method: TRTTIMethod): Boolean;
begin
  Result := GetCurrentThreadID = MainThreadID;
end;

{ NotMainThreadAttribute }

function NotMainThreadAttribute.Execute(Method: TRTTIMethod): Boolean;
begin
  Result := GetCurrentThreadID <> MainThreadID;
end;

{ DeprecatedAttribute }

function DeprecatedAttribute.Execute(Method: TRTTIMethod): Boolean;
begin
  OutputDebugString(PChar(Method.Name + ' was called.'#13#10));
  Result := True;
end;

end.
There you have it — a “real”usecasefor attributes in Delphi. The key advantages I see to this approach, as opposed to, say function-level assertions, is that a birds-eye view of your class will help you to understand the preconditions for each member function, and these preconditions can be consistently and simply tested.
Using a class helper makes it easy to inject the additional functionality into every class that is touched by attribute validation, without polluting the class hierarchy. This means that attribute tests can be seamlessly added to existing infrastructure and Delphi child classes such as TForm.
Full source: AttrVal.zip. License: MPL 2.0. YMMV and use at your own risk.
A new frenzy grips the architects, the builders, the carpenters, the painters. The buildings must be changed, must grow, now, now, today. And so they scurry, nailing on curlicues and raising floors, tearing down this staircase, putting up this ladder, and at the end of the day they step back, look up, shake hands and agree to do it again tomorrow, now, now!
In the midst of the twisted roadways runs the river, and across its waters lies a bridge. Call it London Bridge. Not designed. Just happened. And always growing, this way and that way, a feature here, don’t like that one there any more, should bring this railing up to spec, cries the engineer, whilst beside him the others hammer together the new houses that crowd the bridge’s fragile shoulders, and yet again it crumbles, down into the rushing waters, patched even as it falls, and saved at the last moment by the railing that the engineer brought up to spec. But touch not the railing now, lest the whole bridge collapse. Heedlessly, the crowds continue to cross the bridge.
Nestled amongst the towers of this city is a little house. Built by yours truly, it has gables and stands proudly on its own foundations. No one knows how I mixed the concrete, how I discovered for myself the secret formulas of the masons. For now it stands, mirroring the towering edifices surrounding it, calling for its own moment in the light. Crudely, yet lovingly, its facets are shaped, aping the towers’ gleaming edges.
For none can see the bones of those towers now, save in the dreams, nay horrors, of the men who built them. Carefully, the gleaming panels were draped over, and hid the gross deformities beneath a respectable skin. The towers reach skyward, bastions of the city, and all seek to build their own towers in homage to them.
None can see the bones? I speak falsely. There are those who live beneath the surface of the living, creaking city. They crawl inside the hidden and forgotten ways, and learn its secrets, for good, for evil and for love of learning secrets. Some, graspers, take their knowledge, and shake the towers with it, as the owners rush to protect and rebuild, patching the bones with sticking plasters and casts painted in cheerful colours.
No one notices the bones of my little house. Bones no better than those of the towers, if a little smaller.
In the University, I discover how to build a crystal palace, beautiful, fragile and empty, devoid of purpose. Perfect in every way except one. For it has no doors and doors cannot be added. I cannot take the bones from the palace and put them into my house. The crystal bones resile from my rough-hewn timber tresses. They shatter.
I hear the men building in a frenzy and the monster grips me too. I rush from room to room of my house, desperate for change and fame and wealth, shifting this, nailing that, never noticing the damage I wreak until out of breath I stop and look back, just in time, recoiling as I realise how close I came to losing my soul. I run from my house, shaking off the claws of the monster as it howls impotently at me, you’ll get left behind!
Down in the market, I wander from stall to stall. Buy this paint! Use these magic bones: make your house into a tower! Be noticed! My house must be festooned with gargoyles to protect those who enter from the crawlers beneath the city’s skin! The noise is unsettling, the message now bland and tasteless. The graspers watch me walking through, asking themselves if I have anything of worth.
Beyond the market lies the city hall, where the men of import gather. I spin a tale of the beauty of my house, desperate to be noticed, and how strong its bones, how elegant its gables. One man turns and sees me, offers wealth beyond my dreams. But inside my heart I now know he offers only the chance to take my house, my pride, for himself, and tear it apart and spread the best of its blocks amongst his towers. And so I reject him, and again I flee.
But then I find the man in the corner of the market. He has no charms to sell me. Instead he tells me of those who still secretly live in the city, building houses with pride, each more robust and trustworthy than the last, and though sometimes they look toward the gleaming edifices wistfully, yet they themselves were once crawlers beneath the surface, for the love of learning secrets. These men and women are gathering, slowly, he tells me, into a guild. A guild that will protect and honour and create buildings that last, unlike those on the bridge, crumbling and tumbling even now, unlike the towers, gleaming and perfect and rotten to the core.
This time of growth and pain and foolishness must be endured, but it shall pass. The wise men of the University shall join us, he proclaims, and together we shall build with beauty and strength. Gradually the towers shall each fail and fall and be replaced by virtuous buildings of grace, beauty and strength, built with love and care for those who live inside them.
I ask if I may join their guild, and ungrudgingly he bids me welcome, and willingly I set myself to learn.
One of the most irritating server configuration issues I’ve run across recently emerged when adding global MIME type mappings to Microsoft Internet Information Services 7 — part of Windows Server 2008 R2.
Basically, if you have a MIME type mapping in a domain or path, and later add a mapping for the same file extension at a higher level in the configuration hierarchy, any subsequent requests to that domain or path will start returning HTTP 500 server errors.
You will not see any indication of conflicts, when you change the higher level MIME type mappings, and you typically only discover the error when a user complains that a specific page or site is down.
When you check your logs, you’ll see an error similar to the following:
\\?\C:\Websites\xxx\www\web.config ( 58) :Cannot add duplicate collection
    entry of type 'mimeMap' with unique key attribute
    'fileExtension' set to '.woff'
Furthermore, if you try and view the MIME types in the path or domain that is faulting within IIS Manager, you will receive the same error and will not be able to either view or address the problem (e.g. by removing the MIME type at that level, which would be the logical way to address the problem). The only way to address the problem in the UI view is to remove the global MIME mapping that is conflicting — or manually edit the web.config file at the lower level.
Not very nice — especially on shared hosts where you may not control the global settings!
Some Delphi types do not have RTTI. This is no fun. This happens when, and I quote:
whereas enumerated constants with a specific value, such as the following, do not have RTTI: type SomeEnum = (e1 = 1, e2 = 2, e3 = 3);
In normal use, this will go unnoticed, and not cause you any grief, until you throw these enumerated types into a generic construct (or have any other need to use RTTI). As soon as you do that, you’ll start getting the unhelpful and misleading “Invalid Class Typecast” exception. (No it’s not a Class!)
To avoid this problem, you must wander into the dark world of pointer casting, because once you are pointing at some data, Delphi no longer cares what its actual type is.
Here’s an example of how to convert a Variant value into a generic type, including support for RTTI-free enums, in a reasonably type-safe way. This is part of a TNullable record type, which mimics, in some ways, the .NET Nullable type. The workings of this type are not all that important for the example, however. This example works with RTTI types, and with one byte non-RTTI enumerated types &mdash you’d need to extend it to support larger enumerated types. While I could reduce the number of steps in the edge case by spelunking directly into the Variant TVarData, that would not serve to clarify the murk.
constructor TNullable<T>.Create(AValue: Variant);
type
  PT = ^T;
var
  v: Byte;
begin
  if VarIsEmpty(AValue) or VarIsNull(AValue) then
    Clear
  else if (TypeInfo(T) = nil) and
    (SizeOf(T) = 1) and
    (VarType(AValue) = varByte) then
  begin
    { Assuming an enum type without typeinfo, have to
      do some cruel pointer magics here to avoid type
      cast errors, so am very careful to validate
      first! }
    v := AValue;
    FValue := PT(@v)^;
  end
  else
    Create(TValue.FromVariant(AValue).AsType<T>);
end;
So what is going on here? Well, first if we are passed Null or “Empty” variant values, then we just clear our TNullable value.
Otherwise we test if (a) we have no RTTI for our generic, and (b) it’s one byte in size, and (c) our variant is also a Byte value. If all these prerequisites are met, we perform the casting, in which we hark back to the ancient incantations with a pointer typecast, taking the address of the value and dereferencing it, fooling the compiler along the way. (Ha ha!)
Finally, we find a modern TValue incantation suffices to wreak the type change for civilised types such as Integer or String.
I was preparing a new git repository today for a website, on my Windows machine, and moving a bunch of existing files over for addition. When I ran git add ., I ran into a weird error:
C:\tavultesoft\website\help.keyman.com> git add .
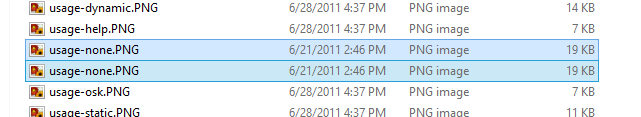
fatal: unable to stat 'desktop/docs/desktop_images/usage-none.PNG': No such file or directory
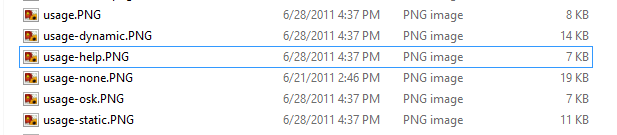
How could a file be there — and not there? I fired up Explorer to find the file and there it was, looked fine. I’d just copied there, so of course it was there!
For a moment, I scratched my head, trying to figure out what could be wrong. The file looked fine. It was in alphabetical order, so it seemed that the letters were of the correct script.
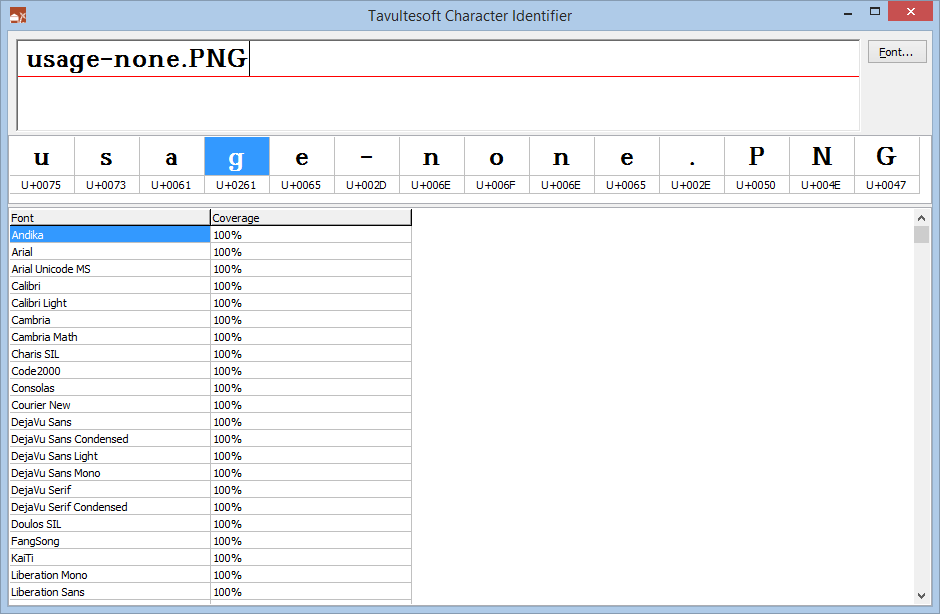
Being merely a bear of little brain, it took me some time to realise that I could just examine the character codepoints in the filename. When this finally sunk in, I quickly pulled out my handy charident tool and copied the filename text to the clipboard:
And pasted it into the Character Identifier:
With a quick scan of the Unicode code points, I quickly noticed that, sure enough, the letter ‘g‘ (highlighted) was not what was expected. It turns out that U+0261 is LATIN SMALL LETTER SCRIPT G, not quite what was anticipated (U+0067 LATIN SMALL LETTER G). And in the Windows 8.1 fonts used in Explorer, the ‘ɡ‘ and ‘g‘ characters look identical!
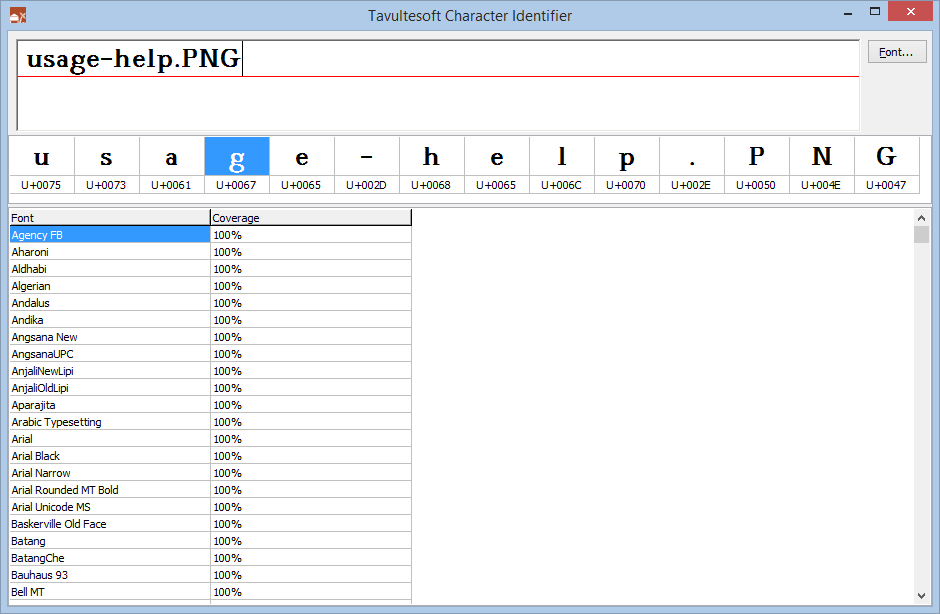
I checked some of the surrounding files as well. And looking at usage-help.PNG, I could see no problems with it:
So why did git get so confused? OK, so git is a tool ported from the another world (“Linux”). It doesn’t quite grok Windows character set conventions for filenames. This is kinda what it saw when looking at the file (yes, that’s from a dir command):
But then somewhere in the process, a normalisation was done on the original filename, converting ɡ to g, and thus it found a mismatch, and reported a missing usage-none.PNG.
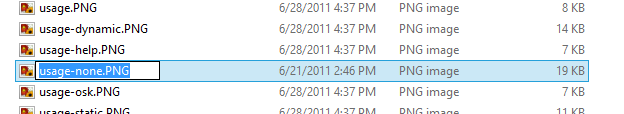
Windows does a similar compatibility normalisation and so confuses the user with seemingly sensible sort orders. But it doesn’t prevent you from creating two files with visually identical names, thus:
I’m sure there’s a security issue there somewhere…
Using WinDbg to debug Delphi processes can be both frustrating and rewarding. Frustrating, because even with the tools available to convert Delphi’s native .TDS symbol file format into .DBG or .PDB, we currently only get partial symbol information. But rewarding when you persist, because even though it may seem obscure and borderline irrational, once you get a handle on the way objects and Run Time Type Information (RTTI) are implemented with Delphi, you can accomplish a lot, quite easily.
For the post today, I’ve created a simple Delphi application which we will investigate in a couple of ways. If you want to follow along, you’ll need to build the application and convert the debug symbols generated by Delphi to .DBG format with map2dbg or tds2dbg. I’ll leave the finer details of that to you — it’s not very complicated. Actually, to save effort, I’ve uploaded both the source, and the debug symbols + dump + executable (24MB zip).
I’ve made reference to a few Delphi internal constants in this post. These are defined in System.pas, and I’m using the constants as defined for Delphi XE2. The values may be different in other versions of Delphi.
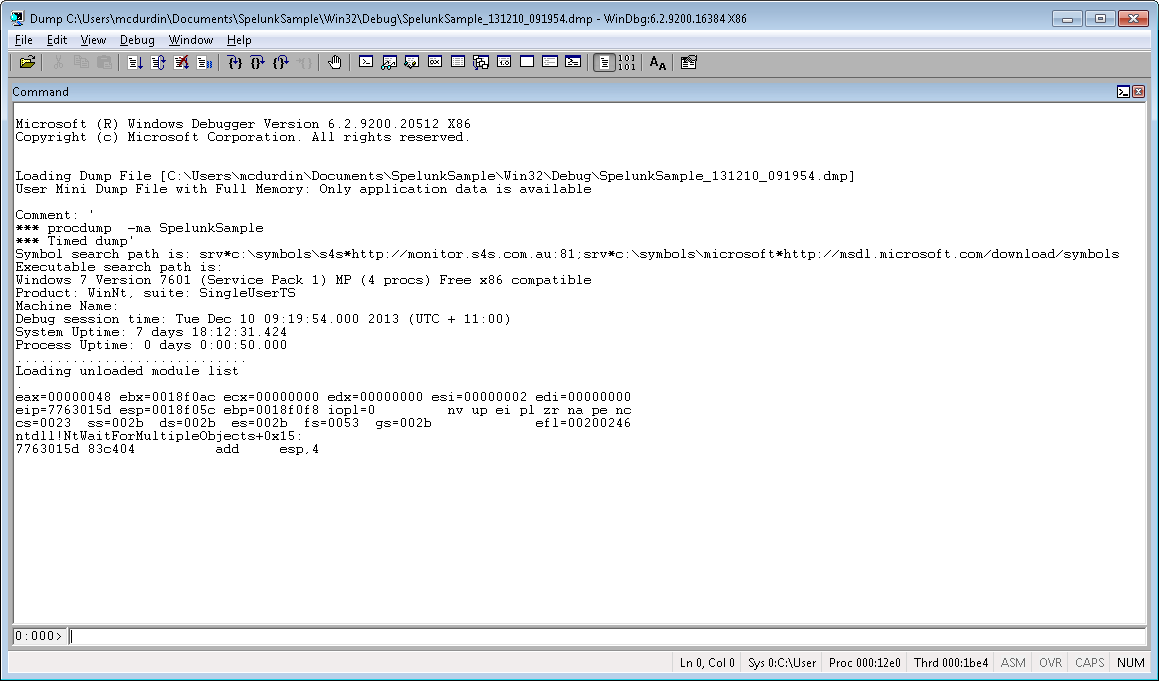
In the simple Delphi application, SpelunkSample, I will be debugging a simulated crash. You can choose to either attach WinDbg to the process while it is running, or to create a crash dump file using a tool such as procdump.exe and then working with the dump file. If you do choose to create a dump file, you should capture the full process memory dump, not just stack and thread information (use -ma flag with procdump.exe).
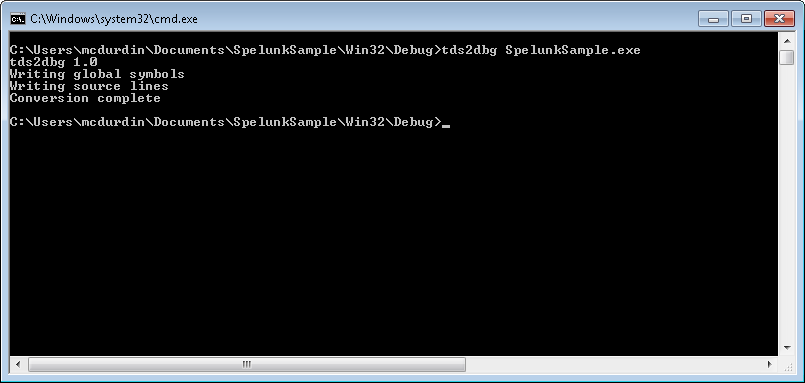
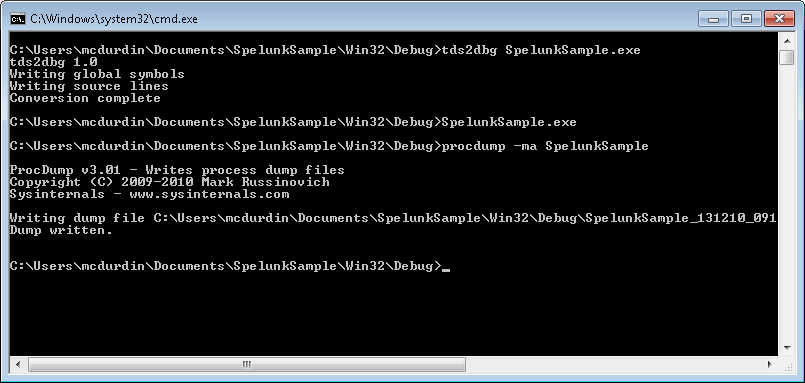
I’ll use procdump.exe. First, I use tds2dbg.exe to convert the symbols into a format that WinDbg groks: Convert Delphi debug symbols
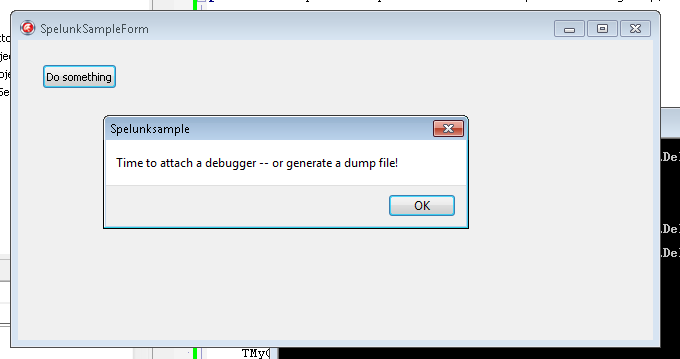
Then I just fire up the SpelunkSample process and click the “Do Something” button. Clicking “Do Something”
Next, I use procdump to capture a dump of the process as it stands. This generates a rather large file, given that this is not much more than a “Hello World” application, but don’t stress, we are not going to be reading the whole dump file in hex (only parts of it). Procdump to give us something to play with
Time to load the dump file up in Windbg.
I want to understand what is going wrong with the process (actually, nothing is going wrong, but bear with me). I figure it’s important to know which forms are currently instantiated. This is conceptually easy enough to do: Delphi provides the TScreen class, which is instantiated as a global singleton accessible via the Screen variable in Vcl.Forms.pas. If we load this up, we can see a member variable FForms: TList, which contains references to all the forms “on the screen”.
But how to find this object in a 60 megabyte dump file? In fact, there are two good methods: use Delphi’s RTTI and track back; and use the global screen variable and track forward. I’ll examine them both, because they both come in handy in different situations.
Finding objects using Delphi’s RTTI
Using Delphi’s Run Time Type Information (RTTI), we can find the name of the class in memory and then track back from that. This information is in the process image, which is mapped into memory at a specific address (by default, 00400000 for Delphi apps, although you can change this in Linker options). So let’s find out where this is mapped:
Now we can search this memory for a specific ASCII string, the class name TScreen. When searching through memory, it’s important to be aware that this is just raw memory. So false positives are not uncommon. If you are unlucky, then the data you are searching for could be repeated many times through the dump, making this task virtually impossible. In practice, however, I’ve found that this rarely happens.
With that in mind, let’s do using the s -a command:
Whoa, that’s a lot of data. Looking at the results though, there are two distinct ranges of memory: 004F#### and 00A#####. Those in the 00A##### range are actually Delphi’s native debug symbols, mapped into memory. So I can ignore those. To keep myself sane, and make the debug console easier to review, I’ll rerun the search for a smaller range:
0:000> s -a 0400000 00a80000 "TScreen"
004f8f81  54 53 63 72 65 65 6e 36-00 90 5b 50 00 06 43 72  TScreen6..[P..Cr
004f9302  54 53 63 72 65 65 6e e4-8b 4f 00 f8 06 44 00 02  TScreen..O...D..
Now, these two references are close together, and I will tell you that the first one is the one we want. Generally speaking, the first one is in the class metadata, and the second one is not important today. Now that we have that "TScreen" string found in memory, we need to go back 1 byte. Why? Because "TScreen" is a Delphi ShortString, which is a string up to 255 bytes long, implemented as a length:byte followed by data (ANSI chars). And then we search for a pointer to that memory location with the s -d command:
Only one reference, nearby in memory, which is expected — the class metadata is generally stored nearby the class implementation. Now this is where it gets a little brain-bending. This pointer is stored in Delphi’s class metadata, as I said. But most this metadata is actually stored in memory before the class itself. Looking at System.pas, in Delphi XE2 we have the following metadata for x86:
Ignore that deprecated noise — it’s the constants that we want to know about. So the vmtClassName is at offset -56 (-38 hex). In other words, to find the class itself, we need to look 56 bytes ahead of the address of that pointer that we just found. That is, 004f8bac + 38h = 004f8be4. Now, if I use the dds (display words and symbols) command, we can see pointers to the implementation of each of the class’s member functions:
Huh. That’s interesting, but it’s a sidetrack; we can see TScreen.Create which suggests we are looking at the right thing. There’s a whole lot more buried in there but it’s not for this post. Let’s go back to where we were.
How do we take that class address and find instances of the class? I’m sure you can see where we are going. But here’s where things change slightly: we are looking in allocated memory now, not just the process image. So our search has to broaden. Rather than go into the complexities of memory allocation, I’m going to go brute force and look across a much larger range of memory, using the L? search parameter (which allows us to search more than 256MB of data at once):
Only two references. Why two and not one, given that we know that TScreen is a singleton? Well, because Delphi helpfully defines a vmtSelf metadata member, at offset -88 (and if we do the math, we see that 004f8be4 - 004f8b8c = 58h = 88d). So let’s look at the second one. That’s our TScreen instance in memory.
In this case, there was only one instance. But you can sometimes pickup objects that have been freed but where the memory has not been reused. There’s no hard and fast way (that I am aware of) of identifying these cases — but using the second method of finding a Delphi object, described below, can help to differentiate.
I’ll come back to how we use this object memory shortly. But first, here’s another way of getting to the same address.
Finding a Delphi object by variable or reference
As we don’t have full debug symbol information at this time, it can be difficult to find variables in memory. For global variables, however, we know that the location is fixed at compile time, and so we can use the disassembler in WinDbg to locate the address relatively simply. First, look in the source for a reference to the Screen global variable. I’ve found it in the FindGlobalComponent function (ironically, that function is doing programatically what we are doing via the long and labourious manual method):
function FindGlobalComponent(const Name: string): TComponent;
var
  I: Integer;
begin
  for I := 0 to Screen.FormCount - 1 do
  begin
    ...
So, disassemble the first few lines of the function. Depending on the conversion tool you used, the symbol format may vary (x spelunksample!*substring* can help in finding symbols).
The highlighted address there corresponds to the Screen variable. The initialization+0xb1ac rubbish suggests missing symbol information, because (a) it doesn’t make much sense to be pointing to the “initialization” code, and (b) the offset is so large. And in fact, that is the case, we don’t have symbols for global variables at this time (one day).
But because we know this, we also know that 00524300 is the address of the Screen variable. The variable, which is a pointer, not the object itself! But because it’s a pointer, it’s easy to get to what it’s pointing to!
0:000> dd 00524300 L1
00524300  0247b370
Look familiar? Yep, it’s the same address as we found the RTTI way, and somewhat more quickly too. But now on to finding the list of forms!
Examining object members
Let’s dump that TScreen instance out and annotate its members. The symbols below I’ve manually added to the data, by looking at the implementation of TComponent and TScreen. I’ve also deleted some misleading annotations that Windbg added.
How did I map that? It’s not that hard — just look at the class definitions in the Delphi source. You do need to watch out for two things: packing, and padding. x86 processors expect variables to be aligned on a boundary of their size, so a 4 byte DWORD will be aligned on a 4 byte boundary. Conversely, a boolean only takes a byte of memory, and multiple booleans can be packed into a single DWORD. Delphi does not do any ‘intelligent’ reordering of object members (which makes life a lot simpler), so this means we can just map pretty much one-to-one. The TComponent object has the following member variables (TPersistent and TObject don’t have any member variables):
Let’s look at 02489da8, the FForms TList object. The first member variable of TList is FList: TPointerList. Knowing what we do about the object structure, we can:
It can be helpful to do a sanity check here and make sure that we haven’t gone down the wrong rabbit hole. Let’s check that this is actually a TList (poi deferences a pointer, but you should be able to figure the rest out given the discussion above):
0:000> da poi(004369e8-38)+1
00436b19  "TList'"
And yes, it is a TList, so we haven’t dereferenced the wrong pointer. All too easy to do in the dark cave that is assembly-language debugging. Back to the lead. We can see from the definition of TList:
Yes, it’s our form! But what is with that poi poi poi? Well, I could have dug down each layer one step at a time, but this is a shortcut, in one swell foop dereferencing the variable, first to the object, then dereferencing to the class, then back 38h bytes and dereferencing to the class name, and plus one byte for that ShortString hiccup. Saves time, and once familiar you can turn it into a WinDbg macro. But it’s helpful to be familiar with the structure first!
Your challenge
Your challenge now is to list each of the TMyObject instances currently allocated. I’ve added a little spice: one of them has been freed but some of the data may still be in the dump. So you may find it is not enough to just use RTTI to find the data — recall that the search may find false positives and freed instances. You should find that searching for RTTI and also disassembling functions that refer to member variables in the form are useful. Good luck!
Hint: If you are struggling to find member variable offsets to find the list, the following three lines of code from FormCreate may help (edx ends up pointing to the form instance):
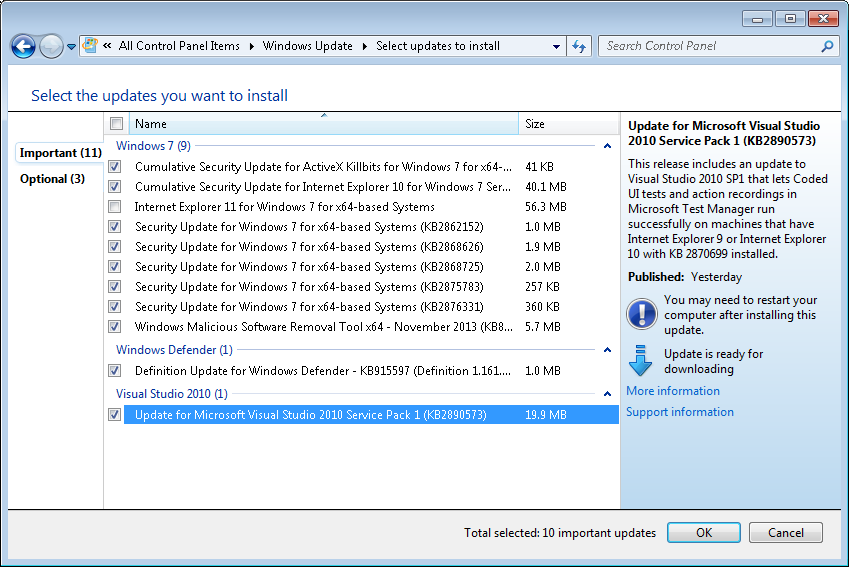
Windows Updates have improved dramatically over the last few years. With Windows 7, the integrated updates install smoothly and without much fuss (apart from the occasional EULA or Internet Explorer Upgrade to throw a spanner in the works).
There’s just one thing. In general, the update titles are useless. Completely useless. “Security Update for Windows 7”? Why else would I be running Windows Update?
Furthermore, the detailed description is also useless — it doesn’t actually provide any details! It’s even more ambiguous than the title! “A security issue has been identified in a Microsoft software product that could affect your system.”
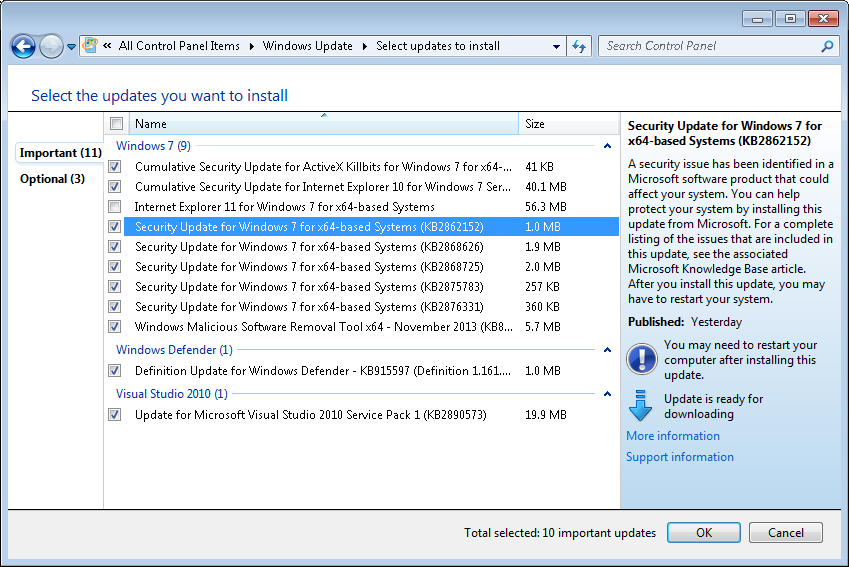
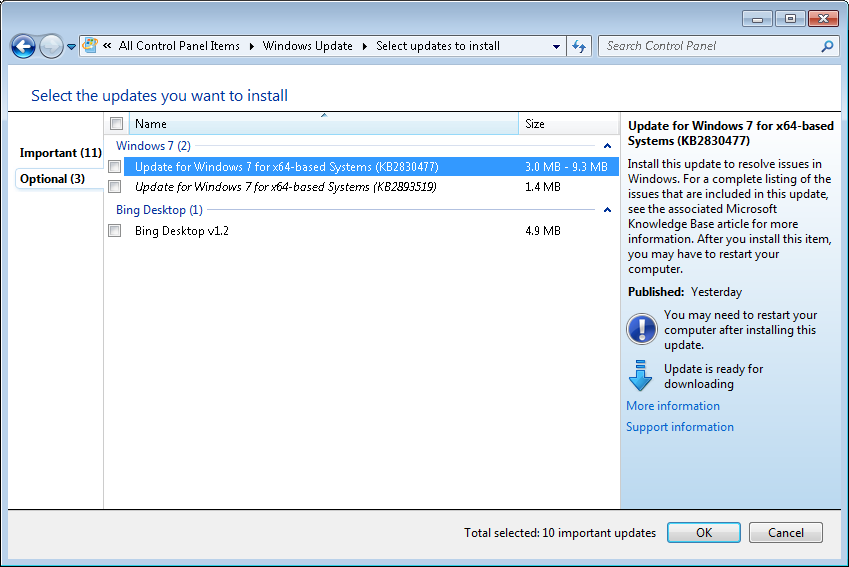
Let’s look at what’s wrong with “Update for Windows 7 for x64-based Systems (KB2830477)”:
It doesn’t tell us what the update actually provides
We already know it’s for Windows 7 — that’s in the group title.
We don’t need to know it’s for x64-based Systems — Windows Update won’t serve us updates for the wrong system type
We couldn’t we see “Update for RemoteApp and Desktop Connections features is available for Windows (KB2830477)”, instead? So which sleeve did I pull that descriptive and useful title from?
Well, the thing is, Microsoft already do know exactly what the update is providing. They have even taken the time to write a succinct title for the update: it’s the title of the Knowledge Base article associated with the update, and it’s even linked to from the update. For example, instead of “Update for Windows 7 (KB2852386)”, we could have “Update: Disk Cleanup Wizard addon lets users delete outdated Windows updates on Windows 7 SP1 (KB2852386)”
Now it’s even worse when using WSUS — you now have to trawl through hundreds of nearly identically titled updates, with only a KB article number to differentiate. So easy to accidentally approve the wrong update. Why, Microsoft, why? Is it so you don’t scare consumers who don’t understand what the update provides? They just press the big “Automatic Updates” button anyway!
Admittedly, Microsoft have taken a big step in the right direction with Visual Studio updates: the description for Visual Studio updates generally gives you some information about what is being updated:
But even that could be improved. We’ve got a lot of repeated information: “Visual Studio 2010” is referenced 4 times: in the group title, in the update title, in the update title in the preview pane, and in the description of the update, again in the preview pane! Surely we don’t need to know that 4 times! And why don’t we go with a title of “Update fixes coded UI test issues for Visual Studio 2010 SP1 in IE9 or IE10 when KB 2870699 is installed (KB2890573)”. Sure it’s a little bit long, but it’s better than “Update for Microsoft Visual Studio 2010 Service Pack 1 (KB2890573)”.
So in conclusion, may I ask you, Microsoft, please, fix these update titles? Just start giving us titles that mean something? And if you are feeling particularly generous, you could even update the description of the update to add more meaning, not less!
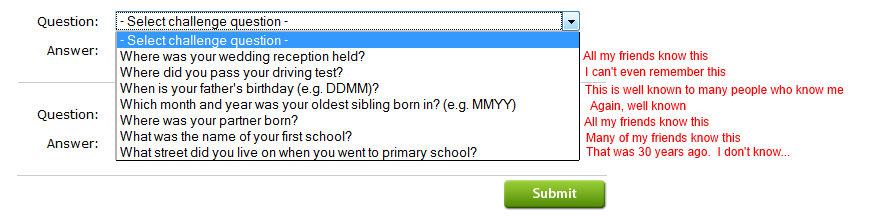
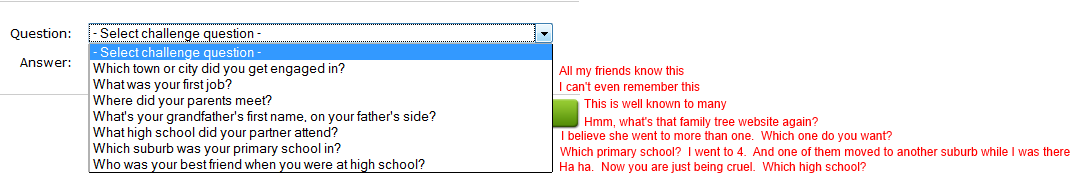
My bank has decided that I have to have some security challenge questions, and gave me a fixed set of questions to add answers to.
They had some simple instructions: “Keep them secret and don’t disclose them to anyone. Don’t write down or record them anywhere.” And added a little threat as icing on the cake: “If you don’t follow these instructions, you may be liable for any loss arising from an unauthorised transaction.”
If I actually attempt to give honest answers to the questions, any determined and reasonably intelligent hacker could find the answers to all the questions that I actually know the answer to, within a minute or two, online, tops.
So what if I opt to use 1-Password or another password management tool to generate secure and random “password” style answers to these questions? These would not be readily memorisable and so I’d have to save them in the tool. But according to their little threat, I can’t do that! That’s called recording the answers to the questions and I could be liable if an unauthorised transfer occurs.
The real problem with questions like this is that too much of this information is recorded online, already. It adds a layer of complexity to the security model, without actually improving security much, if at all.
Then another question arises. If an acquaintance does happen to ask me where I got married, am I now liable to ANZ if I tell them? It sounds ridiculous but lawyers be lawyers. Mind you, given that I have no way of not agreeing to the terms, perhaps it’s unenforceable. The whole thing is really badly thought out.