One of the most irritating server configuration issues I’ve run across recently emerged when adding global MIME type mappings to Microsoft Internet Information Services 7 — part of Windows Server 2008 R2.
Basically, if you have a MIME type mapping in a domain or path, and later add a mapping for the same file extension at a higher level in the configuration hierarchy, any subsequent requests to that domain or path will start returning HTTP 500 server errors.
You will not see any indication of conflicts, when you change the higher level MIME type mappings, and you typically only discover the error when a user complains that a specific page or site is down.
When you check your logs, you’ll see an error similar to the following:
\\?\C:\Websites\xxx\www\web.config ( 58) :Cannot add duplicate collection
    entry of type 'mimeMap' with unique key attribute
    'fileExtension' set to '.woff'
Furthermore, if you try and view the MIME types in the path or domain that is faulting within IIS Manager, you will receive the same error and will not be able to either view or address the problem (e.g. by removing the MIME type at that level, which would be the logical way to address the problem). The only way to address the problem in the UI view is to remove the global MIME mapping that is conflicting — or manually edit the web.config file at the lower level.
Not very nice — especially on shared hosts where you may not control the global settings!
Sometimes it can be handy to test for design-time in a component unit when the component package is first loaded, e.g. within an initialization section, rather than when a component is created or registered. We use this to validate that runtime units that interoperate with a component are linked into a project, and raise an error as early as possible if they are not.
With Delphi’s RTTI, this is fairly straightforward, I believe:
function IsDesignTime: Boolean;
begin
  Result := TRttiContext.Create.FindType('ToolsAPI.IBorlandIDEServices') <> nil;
end;
I was preparing a new git repository today for a website, on my Windows machine, and moving a bunch of existing files over for addition. When I ran git add ., I ran into a weird error:
C:\tavultesoft\website\help.keyman.com> git add .
fatal: unable to stat 'desktop/docs/desktop_images/usage-none.PNG': No such file or directory
How could a file be there — and not there? I fired up Explorer to find the file and there it was, looked fine. I’d just copied there, so of course it was there!
For a moment, I scratched my head, trying to figure out what could be wrong. The file looked fine. It was in alphabetical order, so it seemed that the letters were of the correct script.
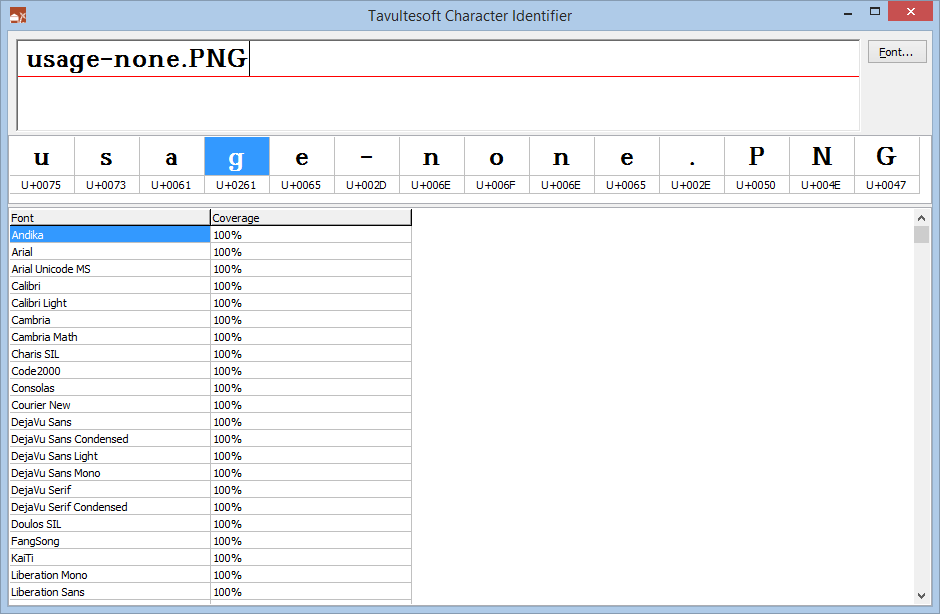
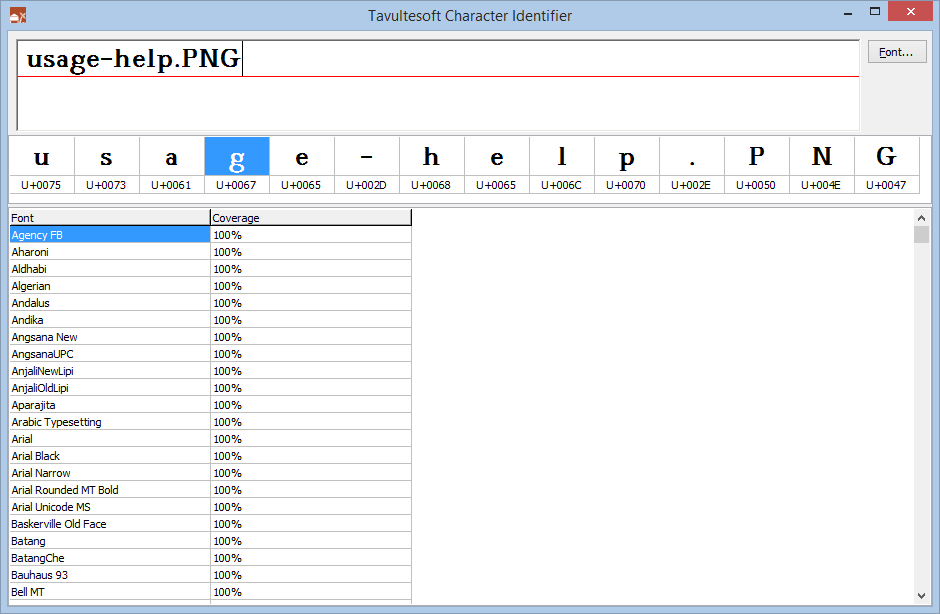
Being merely a bear of little brain, it took me some time to realise that I could just examine the character codepoints in the filename. When this finally sunk in, I quickly pulled out my handy charident tool and copied the filename text to the clipboard:
And pasted it into the Character Identifier:
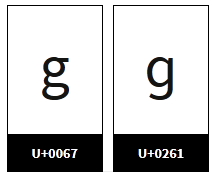
With a quick scan of the Unicode code points, I quickly noticed that, sure enough, the letter ‘g‘ (highlighted) was not what was expected. It turns out that U+0261 is LATIN SMALL LETTER SCRIPT G, not quite what was anticipated (U+0067 LATIN SMALL LETTER G). And in the Windows 8.1 fonts used in Explorer, the ‘ɡ‘ and ‘g‘ characters look identical!
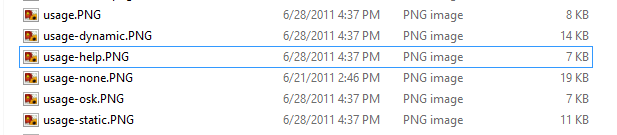
I checked some of the surrounding files as well. And looking at usage-help.PNG, I could see no problems with it:
So why did git get so confused? OK, so git is a tool ported from the another world (“Linux”). It doesn’t quite grok Windows character set conventions for filenames. This is kinda what it saw when looking at the file (yes, that’s from a dir command):
But then somewhere in the process, a normalisation was done on the original filename, converting ɡ to g, and thus it found a mismatch, and reported a missing usage-none.PNG.
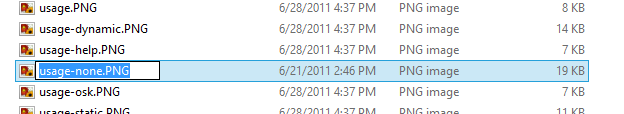
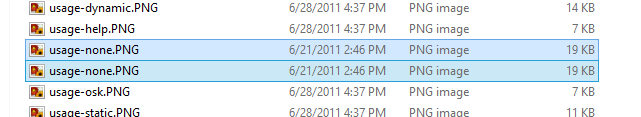
Windows does a similar compatibility normalisation and so confuses the user with seemingly sensible sort orders. But it doesn’t prevent you from creating two files with visually identical names, thus:
I’m sure there’s a security issue there somewhere…
Using WinDbg to debug Delphi processes can be both frustrating and rewarding. Frustrating, because even with the tools available to convert Delphi’s native .TDS symbol file format into .DBG or .PDB, we currently only get partial symbol information. But rewarding when you persist, because even though it may seem obscure and borderline irrational, once you get a handle on the way objects and Run Time Type Information (RTTI) are implemented with Delphi, you can accomplish a lot, quite easily.
For the post today, I’ve created a simple Delphi application which we will investigate in a couple of ways. If you want to follow along, you’ll need to build the application and convert the debug symbols generated by Delphi to .DBG format with map2dbg or tds2dbg. I’ll leave the finer details of that to you — it’s not very complicated. Actually, to save effort, I’ve uploaded both the source, and the debug symbols + dump + executable (24MB zip).
I’ve made reference to a few Delphi internal constants in this post. These are defined in System.pas, and I’m using the constants as defined for Delphi XE2. The values may be different in other versions of Delphi.
In the simple Delphi application, SpelunkSample, I will be debugging a simulated crash. You can choose to either attach WinDbg to the process while it is running, or to create a crash dump file using a tool such as procdump.exe and then working with the dump file. If you do choose to create a dump file, you should capture the full process memory dump, not just stack and thread information (use -ma flag with procdump.exe).
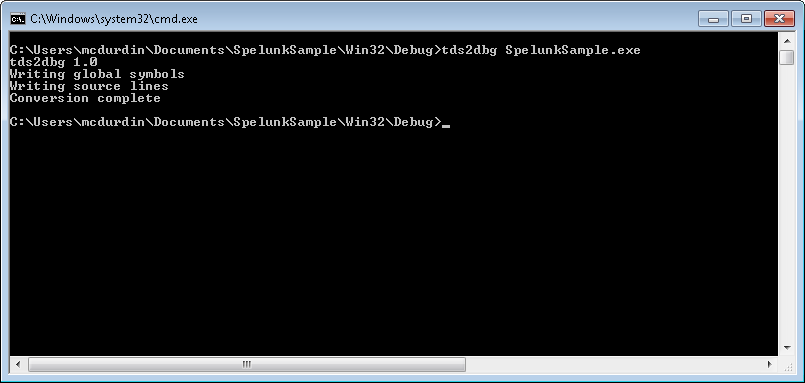
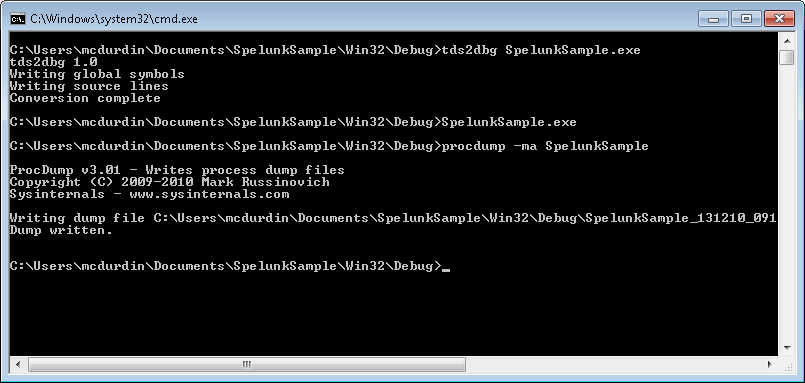
I’ll use procdump.exe. First, I use tds2dbg.exe to convert the symbols into a format that WinDbg groks: Convert Delphi debug symbols
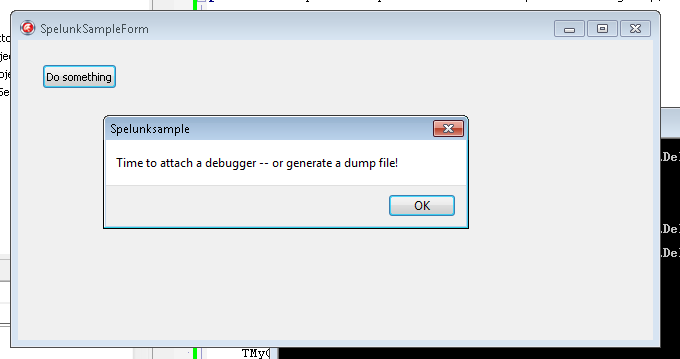
Then I just fire up the SpelunkSample process and click the “Do Something” button. Clicking “Do Something”
Next, I use procdump to capture a dump of the process as it stands. This generates a rather large file, given that this is not much more than a “Hello World” application, but don’t stress, we are not going to be reading the whole dump file in hex (only parts of it). Procdump to give us something to play with
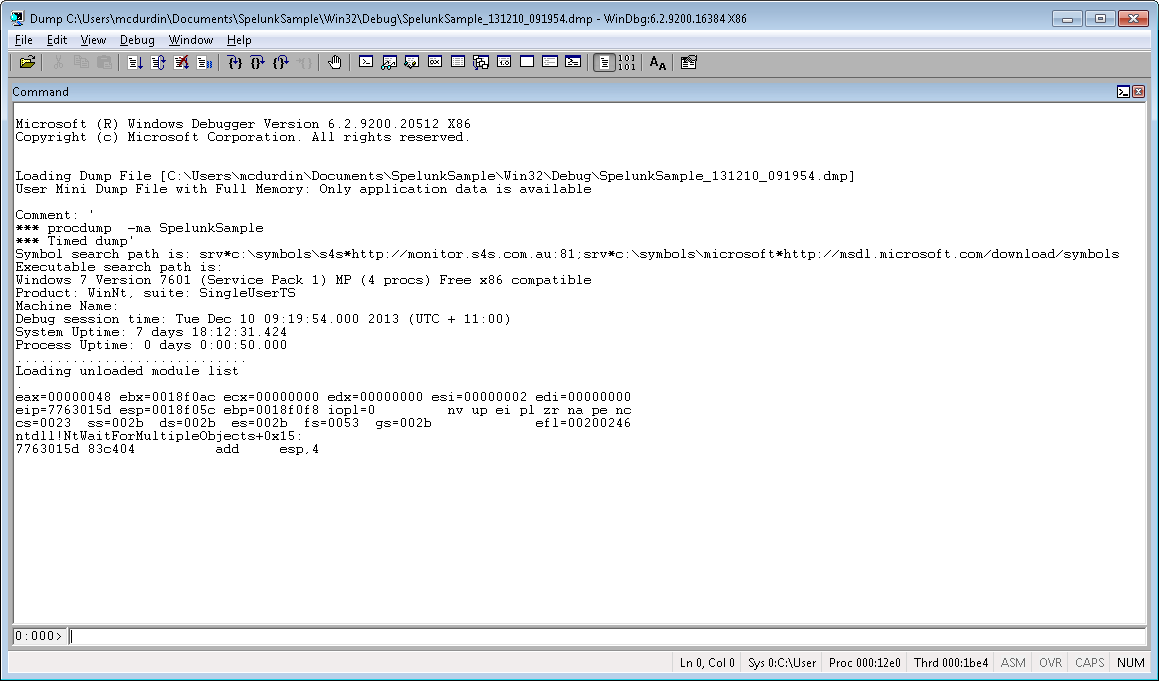
Time to load the dump file up in Windbg.
I want to understand what is going wrong with the process (actually, nothing is going wrong, but bear with me). I figure it’s important to know which forms are currently instantiated. This is conceptually easy enough to do: Delphi provides the TScreen class, which is instantiated as a global singleton accessible via the Screen variable in Vcl.Forms.pas. If we load this up, we can see a member variable FForms: TList, which contains references to all the forms “on the screen”.
But how to find this object in a 60 megabyte dump file? In fact, there are two good methods: use Delphi’s RTTI and track back; and use the global screen variable and track forward. I’ll examine them both, because they both come in handy in different situations.
Finding objects using Delphi’s RTTI
Using Delphi’s Run Time Type Information (RTTI), we can find the name of the class in memory and then track back from that. This information is in the process image, which is mapped into memory at a specific address (by default, 00400000 for Delphi apps, although you can change this in Linker options). So let’s find out where this is mapped:
Now we can search this memory for a specific ASCII string, the class name TScreen. When searching through memory, it’s important to be aware that this is just raw memory. So false positives are not uncommon. If you are unlucky, then the data you are searching for could be repeated many times through the dump, making this task virtually impossible. In practice, however, I’ve found that this rarely happens.
With that in mind, let’s do using the s -a command:
Whoa, that’s a lot of data. Looking at the results though, there are two distinct ranges of memory: 004F#### and 00A#####. Those in the 00A##### range are actually Delphi’s native debug symbols, mapped into memory. So I can ignore those. To keep myself sane, and make the debug console easier to review, I’ll rerun the search for a smaller range:
0:000> s -a 0400000 00a80000 "TScreen"
004f8f81  54 53 63 72 65 65 6e 36-00 90 5b 50 00 06 43 72  TScreen6..[P..Cr
004f9302  54 53 63 72 65 65 6e e4-8b 4f 00 f8 06 44 00 02  TScreen..O...D..
Now, these two references are close together, and I will tell you that the first one is the one we want. Generally speaking, the first one is in the class metadata, and the second one is not important today. Now that we have that "TScreen" string found in memory, we need to go back 1 byte. Why? Because "TScreen" is a Delphi ShortString, which is a string up to 255 bytes long, implemented as a length:byte followed by data (ANSI chars). And then we search for a pointer to that memory location with the s -d command:
Only one reference, nearby in memory, which is expected — the class metadata is generally stored nearby the class implementation. Now this is where it gets a little brain-bending. This pointer is stored in Delphi’s class metadata, as I said. But most this metadata is actually stored in memory before the class itself. Looking at System.pas, in Delphi XE2 we have the following metadata for x86:
Ignore that deprecated noise — it’s the constants that we want to know about. So the vmtClassName is at offset -56 (-38 hex). In other words, to find the class itself, we need to look 56 bytes ahead of the address of that pointer that we just found. That is, 004f8bac + 38h = 004f8be4. Now, if I use the dds (display words and symbols) command, we can see pointers to the implementation of each of the class’s member functions:
Huh. That’s interesting, but it’s a sidetrack; we can see TScreen.Create which suggests we are looking at the right thing. There’s a whole lot more buried in there but it’s not for this post. Let’s go back to where we were.
How do we take that class address and find instances of the class? I’m sure you can see where we are going. But here’s where things change slightly: we are looking in allocated memory now, not just the process image. So our search has to broaden. Rather than go into the complexities of memory allocation, I’m going to go brute force and look across a much larger range of memory, using the L? search parameter (which allows us to search more than 256MB of data at once):
Only two references. Why two and not one, given that we know that TScreen is a singleton? Well, because Delphi helpfully defines a vmtSelf metadata member, at offset -88 (and if we do the math, we see that 004f8be4 - 004f8b8c = 58h = 88d). So let’s look at the second one. That’s our TScreen instance in memory.
In this case, there was only one instance. But you can sometimes pickup objects that have been freed but where the memory has not been reused. There’s no hard and fast way (that I am aware of) of identifying these cases — but using the second method of finding a Delphi object, described below, can help to differentiate.
I’ll come back to how we use this object memory shortly. But first, here’s another way of getting to the same address.
Finding a Delphi object by variable or reference
As we don’t have full debug symbol information at this time, it can be difficult to find variables in memory. For global variables, however, we know that the location is fixed at compile time, and so we can use the disassembler in WinDbg to locate the address relatively simply. First, look in the source for a reference to the Screen global variable. I’ve found it in the FindGlobalComponent function (ironically, that function is doing programatically what we are doing via the long and labourious manual method):
function FindGlobalComponent(const Name: string): TComponent;
var
  I: Integer;
begin
  for I := 0 to Screen.FormCount - 1 do
  begin
    ...
So, disassemble the first few lines of the function. Depending on the conversion tool you used, the symbol format may vary (x spelunksample!*substring* can help in finding symbols).
The highlighted address there corresponds to the Screen variable. The initialization+0xb1ac rubbish suggests missing symbol information, because (a) it doesn’t make much sense to be pointing to the “initialization” code, and (b) the offset is so large. And in fact, that is the case, we don’t have symbols for global variables at this time (one day).
But because we know this, we also know that 00524300 is the address of the Screen variable. The variable, which is a pointer, not the object itself! But because it’s a pointer, it’s easy to get to what it’s pointing to!
0:000> dd 00524300 L1
00524300  0247b370
Look familiar? Yep, it’s the same address as we found the RTTI way, and somewhat more quickly too. But now on to finding the list of forms!
Examining object members
Let’s dump that TScreen instance out and annotate its members. The symbols below I’ve manually added to the data, by looking at the implementation of TComponent and TScreen. I’ve also deleted some misleading annotations that Windbg added.
How did I map that? It’s not that hard — just look at the class definitions in the Delphi source. You do need to watch out for two things: packing, and padding. x86 processors expect variables to be aligned on a boundary of their size, so a 4 byte DWORD will be aligned on a 4 byte boundary. Conversely, a boolean only takes a byte of memory, and multiple booleans can be packed into a single DWORD. Delphi does not do any ‘intelligent’ reordering of object members (which makes life a lot simpler), so this means we can just map pretty much one-to-one. The TComponent object has the following member variables (TPersistent and TObject don’t have any member variables):
Let’s look at 02489da8, the FForms TList object. The first member variable of TList is FList: TPointerList. Knowing what we do about the object structure, we can:
It can be helpful to do a sanity check here and make sure that we haven’t gone down the wrong rabbit hole. Let’s check that this is actually a TList (poi deferences a pointer, but you should be able to figure the rest out given the discussion above):
0:000> da poi(004369e8-38)+1
00436b19  "TList'"
And yes, it is a TList, so we haven’t dereferenced the wrong pointer. All too easy to do in the dark cave that is assembly-language debugging. Back to the lead. We can see from the definition of TList:
Yes, it’s our form! But what is with that poi poi poi? Well, I could have dug down each layer one step at a time, but this is a shortcut, in one swell foop dereferencing the variable, first to the object, then dereferencing to the class, then back 38h bytes and dereferencing to the class name, and plus one byte for that ShortString hiccup. Saves time, and once familiar you can turn it into a WinDbg macro. But it’s helpful to be familiar with the structure first!
Your challenge
Your challenge now is to list each of the TMyObject instances currently allocated. I’ve added a little spice: one of them has been freed but some of the data may still be in the dump. So you may find it is not enough to just use RTTI to find the data — recall that the search may find false positives and freed instances. You should find that searching for RTTI and also disassembling functions that refer to member variables in the form are useful. Good luck!
Hint: If you are struggling to find member variable offsets to find the list, the following three lines of code from FormCreate may help (edx ends up pointing to the form instance):
Today I’ve got a process on my machine that is supposed to be exiting, but it has hung. Let’s load it up in Windbg and find what’s up. The program in question was built in Delphi XE2, and symbols were generated by our internal tds2dbg tool (but there are other tools online which create similar .dbg files). As usual, I am writing this up for my own benefit as much as anyone else’s, but if I put it on my blog, it forces me to put in enough detail that even I can understand it when I come back to it!
Looking at the main thread, we can see unit finalizations are currently being called, but the specific unit finalization section and functions which are being called are not immediately visible in the call stack, between InterlockedCompareExchange and FinalizeUnits:
So, the simplest way to find out where we were was to step out of the InterlockedCompareExchange call. I found myself in System.SysUtils.DoneMonitorSupport (specifically, the CleanEventList subprocedure):
0:000> p
eax=01a8ee70 ebx=01a8ee70 ecx=01a8ee70 edx=00000001 esi=00000020 edi=01a26e80
eip=0042dcb1 esp=0018ff20 ebp=0018ff3c iopl=0         nv up ei pl nz na po nc
cs=0023  ss=002b  ds=002b  es=002b  fs=0053  gs=002b             efl=00200202
audit4_patient!CleanEventList+0xd:
0042dcb1 33c9            xor     ecx,ecx
After a little more spelunking, and a review of the Delphi source around this function, I found that this was a part of the System.TMonitor support. Specifically, there was a locked TMonitor somewhere that had not been destroyed. I stepped through a loop that was spinning, waiting for the object to be unlocked so its handle could be destroyed, and found a reference to the data in question here:
0:000> p
eax=00000001 ebx=01a8ee70 ecx=01a8ee70 edx=00000001 esi=00000020 edi=01a26e80
eip=0042dcaf esp=0018ff20 ebp=0018ff3c iopl=0         nv up ei pl nz na po nc
cs=0023  ss=002b  ds=002b  es=002b  fs=0053  gs=002b             efl=00200202
audit4_patient!CleanEventList+0xb:
0042dcaf 8bc3            mov     eax,ebx
Looking at the record pointed to by ebx, we had a reference to an event handle handy:
Although Event is a Pointer, internally it’s just cast from an event handle. So I guess that we can probably find another reference to that handle somewhere in memory, corresponding to a TMonitor record:
Now one of these should correspond to a TMonitor record. The first entry (01a8ee74) is just part of our TSyncEventItem record, and the next three don’t make sense given that the FSpinCount (the next value in the memory dump) would be invalid. So let’s look at the last one. Counting quickly on all my fingers and toes, I establish that that makes 08a47538 the start of the TMonitor record. And… so we search for a pointer to that.
Just one! But here it gets a little tricky, because the PMonitor pointer is in a ‘hidden’ field at the end of the object. So we need to locate the start of the object.
I’m just stabbing in the dark here, but that 004015c8 that’s just four bytes back smells suspiciously like an object class pointer. Let’s see:
0:000> da poi(4015c8-38)+1
004016d7  "TObject&"
Ta da! That all fits. A TObject has no data members, so the next 4 bytes should be the TMonitor (search for hfMonitorOffset in the Delphi source to learn more). So we have a TObject being used as a TMonitor lock reference. (Learn about that poi(address-38)+1 magic). But what other naughty object is hanging about, using this TObject as its lock?
  TThreadList = class
  private
    FList: TList;
    FLock: TObject;
    FDuplicates: TDuplicates;
Yes, that definitely looks hopeful! That FLock is pointing to our lock TObject… I believe that’s called a Quality Match.
This is still a little bit too generic for me, though. TThreadList is a standard Delphi class used by the bucketload. Let’s try and identify who is using this list and leaving it lying about. First, we’ll quickly have a look at that TThreadList.FList to see if it has anything of interest — that’s the first data member in the object == object+4.
Yep, it’s a TList. Just making sure. It’s empty, what a shame (TList.FCount is the second data member in the object == 00000000, as is the list pointer itself).
So how else can we find the usage of that TThreadList? Is it TThreadList referenced anywhere then? Break out the search tool again!
0:000> !handle 91c
Could not duplicate handle 91c, error 6
That suggests that the object has already been destroyed. But that the TThreadList hasn’t.
And sure enough, when I looked at the destructor for TAnatomyDiagramTileLoadThread, we clear the TThreadList, but we never free it!
Now, another way we could have caught this was to turn on leak detection. But leak detection is not always perfect, especially when you get some libraries that *cough* have a lot of false positives. And of course while we could have switched on heap leak detection, that involves rebuilding and restarting the process and losing the context along the way, with no guarantee we’ll be able to reproduce it again!
While this approach does feel a little tedious, and we did have some luck in this instance with freed objects not being overwritten, and the values we were searching for being relatively unique, it does nevertheless feel pretty deterministic, which must be better than the old “try-it-and-hope” debugging technique.
One of my favourite Windows tools is Procmon. I pull it out regularly, often as a first port of call when diagnosing complicated and opaque problems in the software I develop. Or in anyone’s software, really.
Procmon captures a trace of key I/O activities on your computer, including file, registry and network activity, and makes it really easy to spot operations that have failed or that may be causing problems. It’s great for spotting authentication problems, sharing violations, missing files and more (… malware). Procmon goes as far as recording a stack trace for nearly every operation it captures!
Today, we were trying to diagnose a problem with a process that was taking 15 seconds or longer to start on a Windows XP computer. The normal start time for that process should have been 1-2 seconds. None of the usual culprits came forward and admitted fault, so it was time to pull out Procmon again.
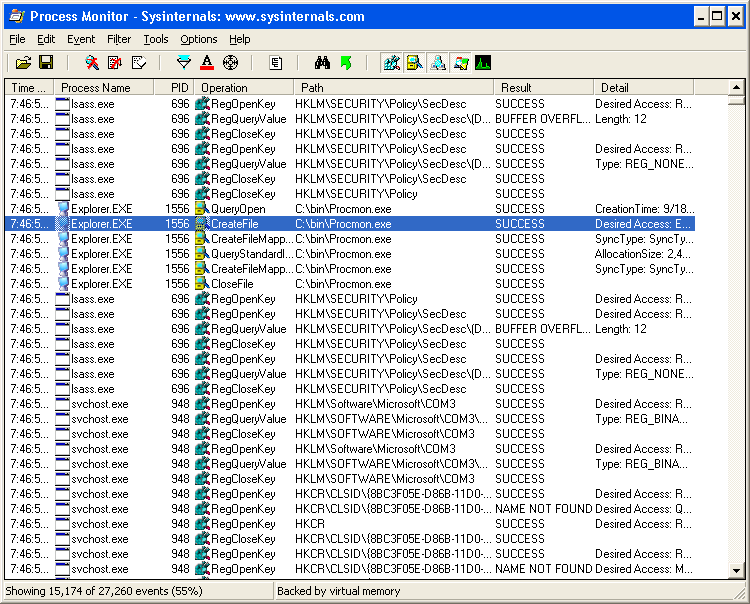
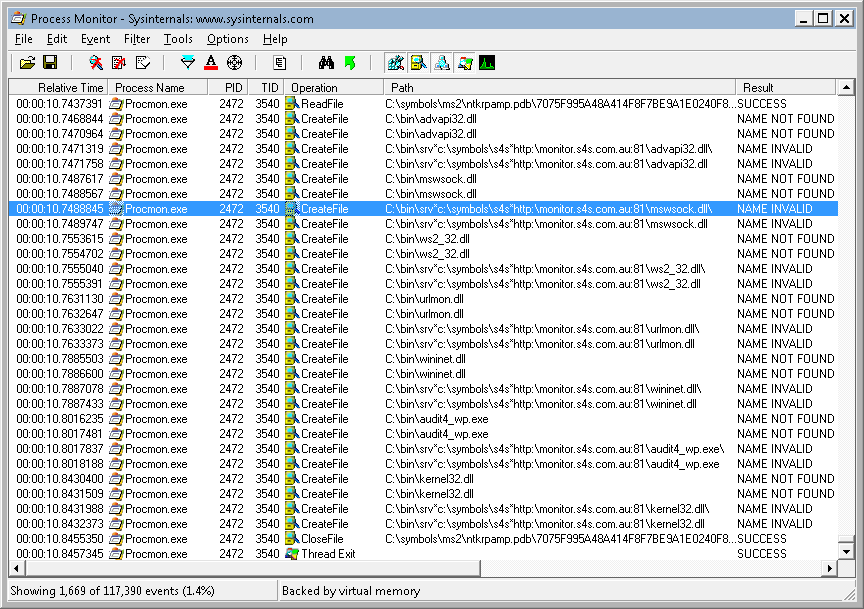
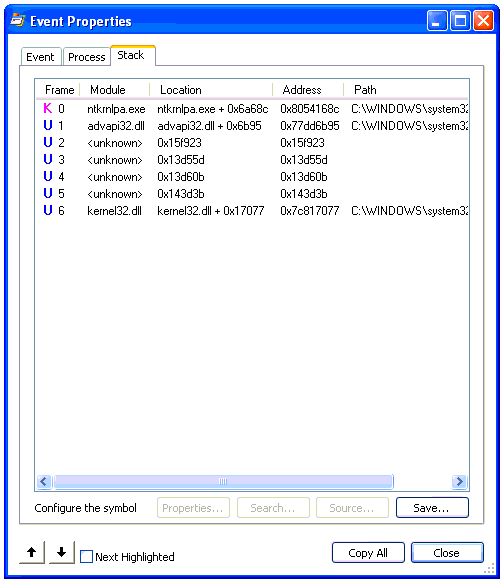
We quickly spotted a big fat delay in the trace. Note the time stamps in the two selected rows in the screen capture below.
A big time gap between 4:10:04 and 4:10:17
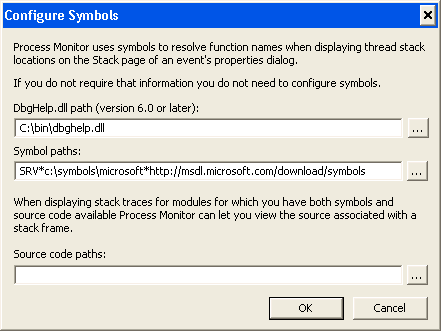
Now it was time to try and find out what was causing this. So we examined the stack trace for each entry, except … there were no symbols. Easy enough to fix — copy dbghelp.dll from a version of Microsoft’s Debugging Tools for Windows onto the system temporarily, fixup the symbol path in Procmon’s options, and … nope, still no symbols. Now this is one area where Procmon falls down a little bit. If symbol loading fails, it just silently fails. No warnings, errors or hints as to what might be going on.
This issue was occurring on a client’s computer, so it was time to take the investigation elsewhere for examination. Before we could really examine the captured trace, we needed to get symbols going. But how?
Procmon to the rescue!
That’s right, we realised we can use Procmon to diagnose itself! I booted up a clean new Windows XP virtual machine, loaded Procmon onto it, ran a basic capture of some random events.
A trace on XPNo symbols showing, only exportsConfiguring symbols for Procmon
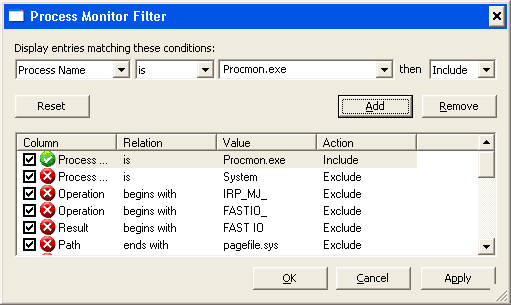
Even after configuring symbols, they still silently failed to load. So I stopped the capture, saved it and immediately opened the saved capture, to stop this instance of Procmon from capturing events on the local computer. I then started a second instance of Procmon, removed the Procmon exclusion from the filtering, and instead, added a filter to include Procmon (I also filtered specifically for the PID of the original Procmon, later):
Configuring Procmon to watch itself
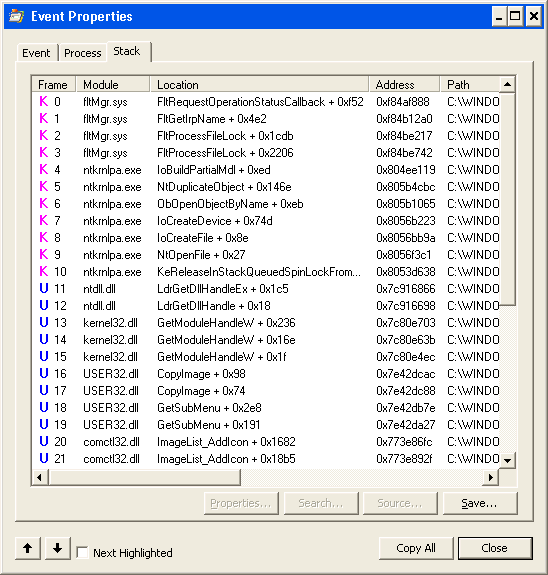
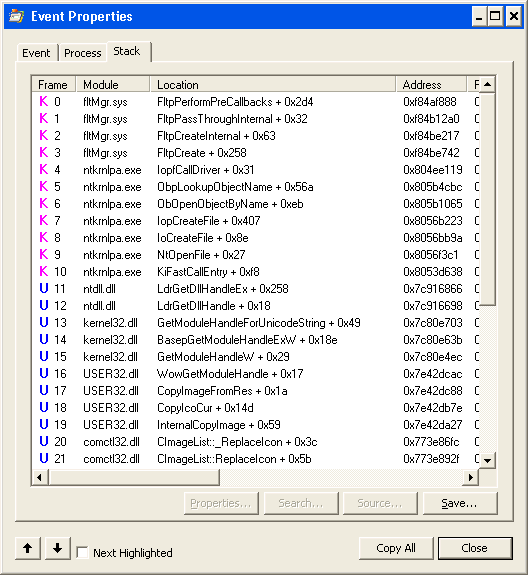
Then I started the trace, switched back to the first Procmon, and tried to examine the stack. Of course, still no symbols, but now it was time to switch back to the second, active Procmon process and see what we found.
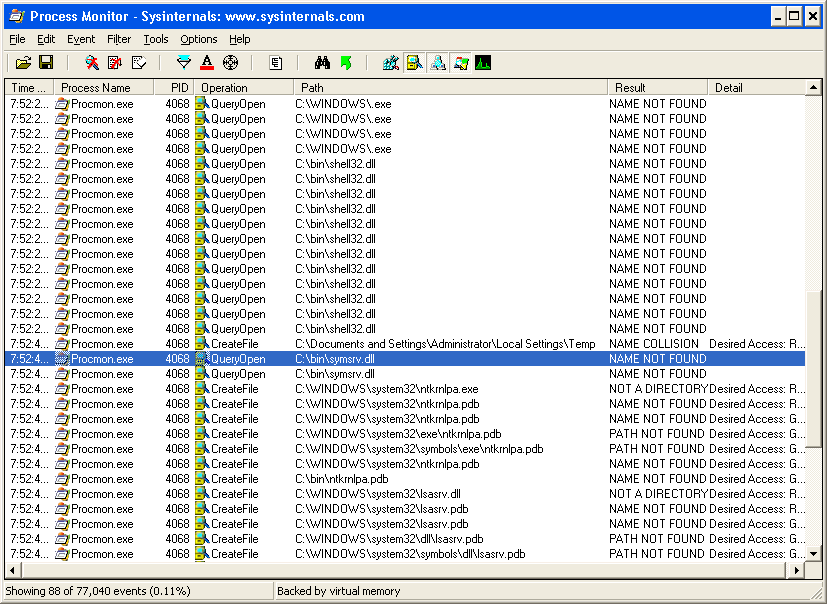
And what we found was that dbghelp.dll was looking for symsrv.dll in order to download its symbols. So we copied that also into the folder with procmon.exe and suddenly everything worked!
dbghelp wants symsrv to help it as wellThe undecorated stack for the symsrv load request
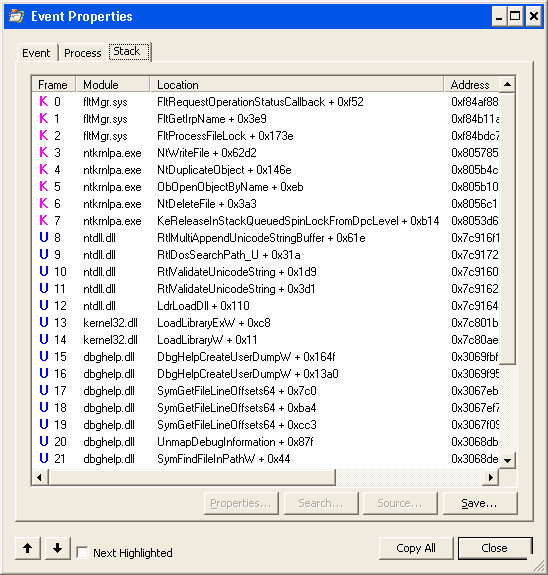
Update 19 Sep 2013: Oops. Forgot to attach the decorated stack (sorry!):
The call stack with symbols loaded. Note how the function names differ from the original stack.
So that’s the first takeaway from this story: when you want symbols, copy both dbghelp.dll and symsrv.dll from your copy of Debugging Tools for Windows. We found no other dependencies, even with the latest version of these files.
A diversion
One curious anomaly we spotted: Procmon (or possibly Dbghelp) is looking in some strange places for debug symbols, including appending a SRV*path*url style symbol path to procmon’s parent path, and looking there, without much success:
Some weirdness in symbol loading
I leave that one for you to solve.
Backtrack to the stack (trace)
Back to the original trace. We loaded up the saved trace, and found that we now got kernel mode symbols just fine, but no user mode symbols would load. In fact, Procmon doesn’t even appear to be looking for symbols for these user mode frames — either on the local drive or on the network. And this time Procmon isn’t able to give us any more detail. However, when we debugged the call that Procmon made to SymFindFileInPath when viewing a call stack in this log vs another new log, we found that Procmon wasn’t even providing the necessary identifying information.
What information is this? The identifying information that the symbol servers use is the TimeDateStamp and the SizeOfImage fields from the PE header of the executable file (slightly different for .pdb files).
I surmise that this identifying information is missing from our original trace because this trace was captured before we copied version 6.0 or later of dbghelp.dll onto the client’s computer — meaning that the version that Procmon used when capturing the trace did not record this identifying information.
Therefore, the second takeaway of the story is: always copy a recent version of dbghelp.dll and symsrv.dll into the folder with procmon.exe, before starting a trace. Even if you intend to analyze the trace later, you’ll find that without these, you won’t get full stack traces.
(Dear Microsoft, please can you consider including these in the Procmon and Procexp downloads, given that you now own Sysinternals? Saves a lot of hassle!)
The offsets used in this blog are correct for Delphi XE2, and this information is only valid for x86. You will have to plug in other values for other versions of Delphi. You can find more details in my earlier Delphi WinDbg blog articles:
The following WinDbg command will return a list of all Delphi exception records located within the stacks of each thread in the process. Delphi uses the exception code 0EEDFADE:
~*e s -d poi(@$teb+8) poi(@$teb+4) 0EEDFADE
If you just wanted to do the current thread, you would run:
s -d poi(@$teb+8) poi(@$teb+4) 0EEDFADE
What is teb? It’s the Thread Environment Block. The data at teb+8 and teb+4 are the current bottom of the stack and the top of the stack, respectively.
For example, when looking at a crash dump we received, we were able to spot exceptions in two different threads:
This has returned exception records in two different thread stacks (0012* and 04a6*). We can see a number of potential exception records; some of these are not really records (because the 0EEDFADE value is not only used in the EXCEPTION_RECORD structure; it is also passed as a parameter to the RaiseException function among others). However, if the 3rd DWORD shown is 0, then this is probably a real exception record, and not part of a function call. Why this? Because EXCEPTION_RECORD's third member is a pointed to a nested exception record, which it seems is always set to NULL in Delphi.
To examine the exception record run the following command:
To confirm that this is a real Delphi exception check two things:
The ExceptionAddress should point to an address within the RaiseException function (that actual address may vary between versions of Windows).
It should have 7 parameters:
0: code address where the exception was raised
1: address of the Exception object
2-6: additional data relating to the exception type and stored registers
0:000> da poi(poi(8c92148)-38)+1
004c214f  "EOleException.!L"
0:000> du poi(8c92148+4)
08cbb20c  "Operation cannot be performed wh"
08cbb22c  "ile executing asynchronously"
You can also skip examining the exception record if you want, with shortcuts such as:
da poi(poi(poi(0012ef6c+18))-38)+1; du poi(poi(0012ef6c+18)+4)
How about working with nested exceptions? Take the following scratch program:
unit NestedExceptions;

interface

uses
  Winapi.Windows, Winapi.Messages, System.SysUtils, System.Variants, System.Classes, Vcl.Graphics,
  Vcl.Controls, Vcl.Forms, Vcl.Dialogs, Vcl.StdCtrls;

type
  TForm1 = class(TForm)
    Button1: TButton;
    procedure Button1Click(Sender: TObject);
  private
    { Private declarations }
  public
    { Public declarations }
  end;

var
  Form1: TForm1;

implementation

{$R *.dfm}

type
  EWhatAMess = class(Exception);

  EAnotherError = class(Exception);

  ESomeError = class(Exception)
  private
    FExtraData: string;
  public
    constructor Create(const Message, ExtraData: string);
  end;

procedure HandleThisOneToo;
begin
  raise EWhatAMess.Create('What a mess');
end;

procedure HandleIt;
begin
  try
    raise EAnotherError.Create('Another Error Message');
  except
    on E:EAnotherError do
      HandleThisOneToo;
  end;
end;

procedure TForm1.Button1Click(Sender: TObject);
begin
  try
    raise ESomeError.Create('Some Error Message', 'Here''s some extra data');
  except
    on E:ESomeError do
      HandleIt;
  end;
end;

{ ESomeError }

constructor ESomeError.Create(const Message, ExtraData: string);
begin
  FExtraData := ExtraData;
  inherited Create(Message);
end;

end.
Build this program, then load it up in WinDbg. You'll need to enable the event filter for 0EEDFADE as per my previous blog. Click the bad, bad button and watch as the exceptions are thrown. For the first two exceptions, just g. On the third exception, we'll spelunk with the search technique.
The first instance of an exception in the stack will have the Exception Flag 00000001. This is the one we are interested in, in each case. Let's look at them:
0:000> da poi(poi(poi(0018e814+18))-38)+1; du poi(poi(0018e814+18)+4)
0051138f  "EWhatAMess"
02548654  "What a mess"
0:000> da poi(poi(poi(0018ee60+18))-38)+1; du poi(poi(0018ee60+18)+4)
00511437  "EAnotherErrorH.Q"
0256c36c  "Another Error Message"
0:000> da poi(poi(poi(0018f4c8+18))-38)+1; du poi(poi(0018f4c8+18)+4)
00511523  "ESomeErrorJ"
02581d3c  "Some Error Message"
You may find that some exception records are no longer valid as they can be overwritten over time. This happens for nested exceptions, unfortunately, if you don't actually break on the exception in WinDbg before it is handled in the application (which will typically be the case if you attach a debugger to a process with an exception dialog visible). In this situation, only the final exception record will point to a live Exception object. You may notice that innermost exception had a little bit of extra data. How do we pull that out? Let's look at the ESomeError object in memory:
An application that I do some development on was having trouble starting on a Windows XP machine. In this application, we hook some of the Windows API functions internally to extend functionality in print preview (long story). However, on this machine, the hook was failing.
The machine had fully up-to-date antivirus software from a major vendor; they’d run various anti-malware programs, but nothing was coming up.
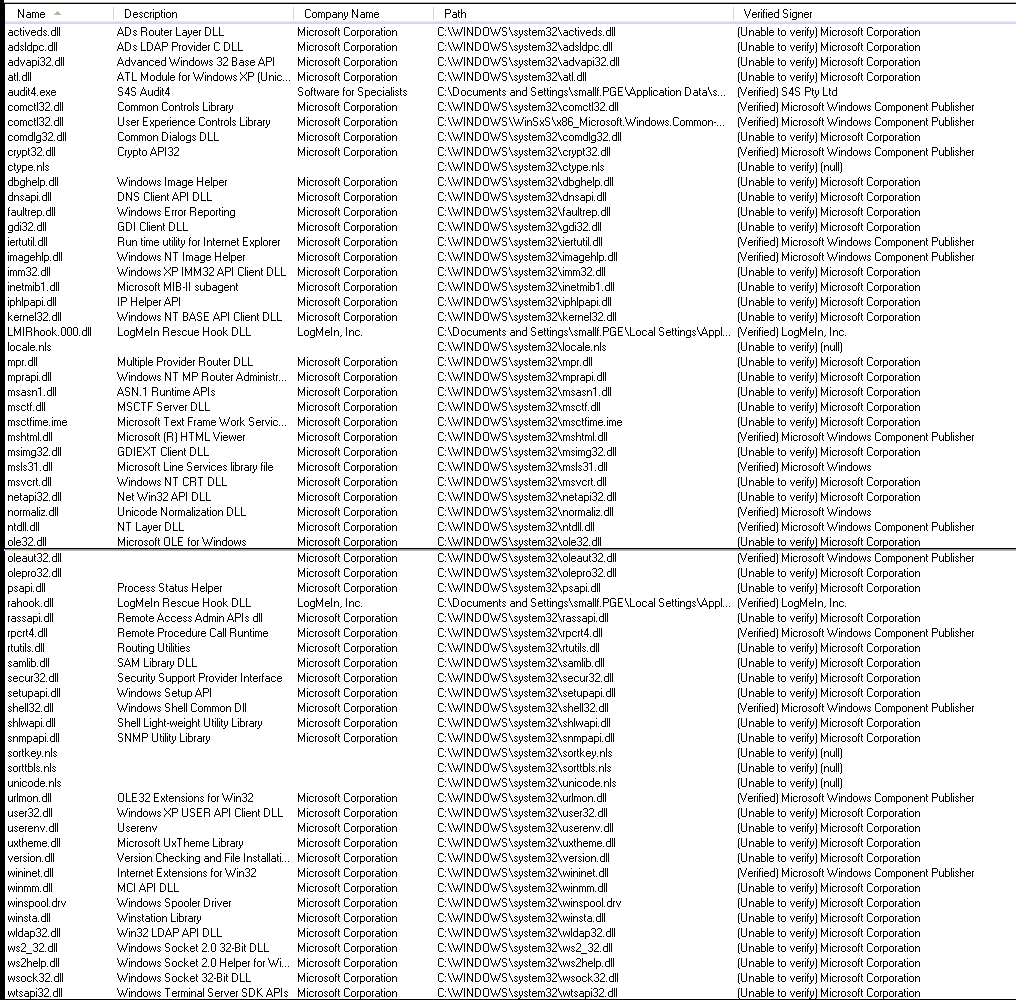
No weird looking processes, DLLs or drivers were visible using Process Explorer; it looked like a pretty clean machine. So after doing the usual diagnostics, we decided to take a full dump of the process when it threw up its error message. A debug message told us that the hook function was failing to hook RegisterClassW, RegisterClassExW, RegisterClassA and RegisterClassExA.
I loaded the dump up in windbg and took a look at the functions.
0:000> u registerclassw
user32!RegisterClassW:
7e41a39a 6849d31300      push    13D349h
7e41a39f c3              ret
7e41a3a0 ec              in      al,dx
7e41a3a1 308b45085657    xor     byte ptr [ebx+57560845h],cl
7e41a3a7 6a09            push    9
7e41a3a9 59              pop     ecx
7e41a3aa 8d7004          lea     esi,[eax+4]
7e41a3ad 8b00            mov     eax,dword ptr [eax]
Whoa. Push what? That’s definitely not what we normally see! Here’s what we’d expect to see:
So that push followed by ret is going to jump to address 13D349. Let’s look to see which module owns that address space:
0:000> !address 13D349
Usage:
Allocation Base:        00000000
Base Address:           00130000
End Address:            00169000
Region Size:            00039000
Type:                   00000000
State:                  00000000
Protect:                00000000
So, not in the image space of a normally loaded module then. So who is allocating that memory? Let’s look for some strings longer than 3 characters in that block:
0:000> s -sa 00130000 00169000
This returned a stack of garbage data , but some strings stood out:
00131fb8 "Coded by BRIAN KREBS for persona"
00131fd8 "l use only. I love my job & wife"
00131ff8 "."
...
00136f08 "http://%02x%02x%02x%02x%02x%02x%"
00136f28 "02x%02x.com/%02x%02x%02x%02x/%02"
00136f48 "x%02x%02x%02x.php"
...
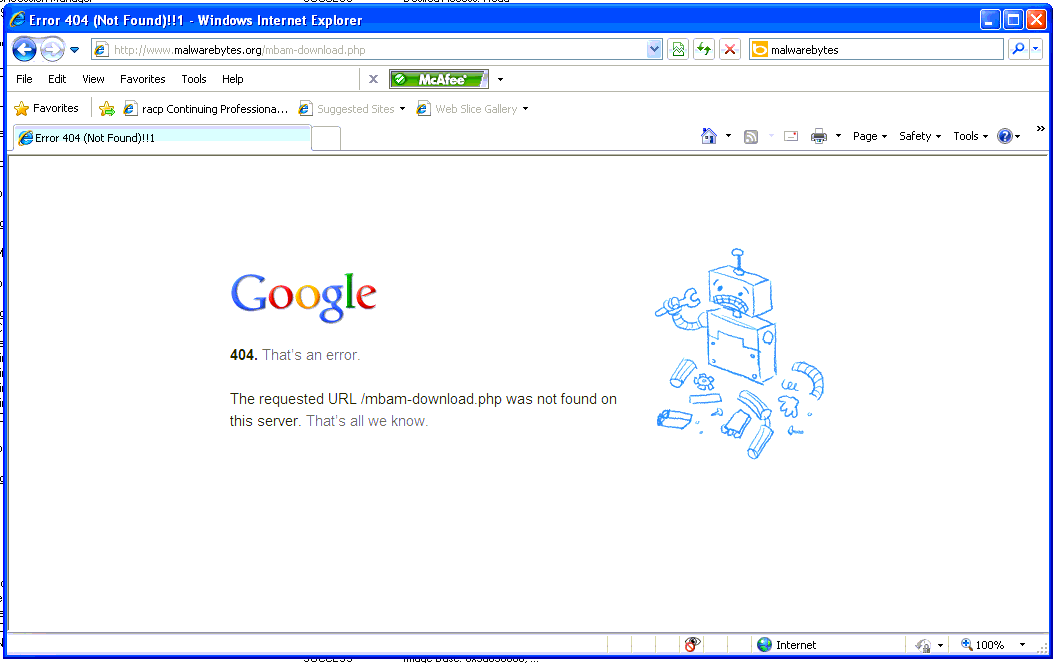
00138eac "http://www.google.com/webhp"
...
00139424 "facebook.com"
00139438 "%BOTID%"
00139440 "%BOTNET%"
...
That first one was a dead giveaway. Brian Krebs is a security researcher. A Google search found that the Citadel Trojan embedded that string.
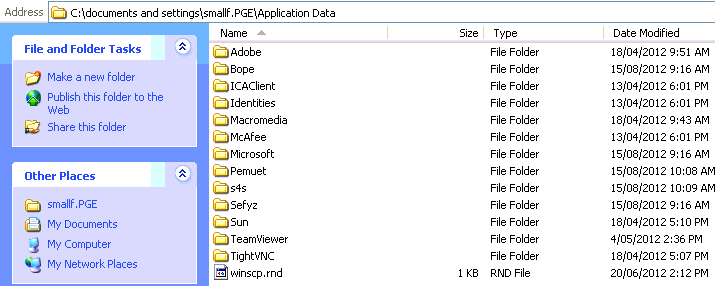
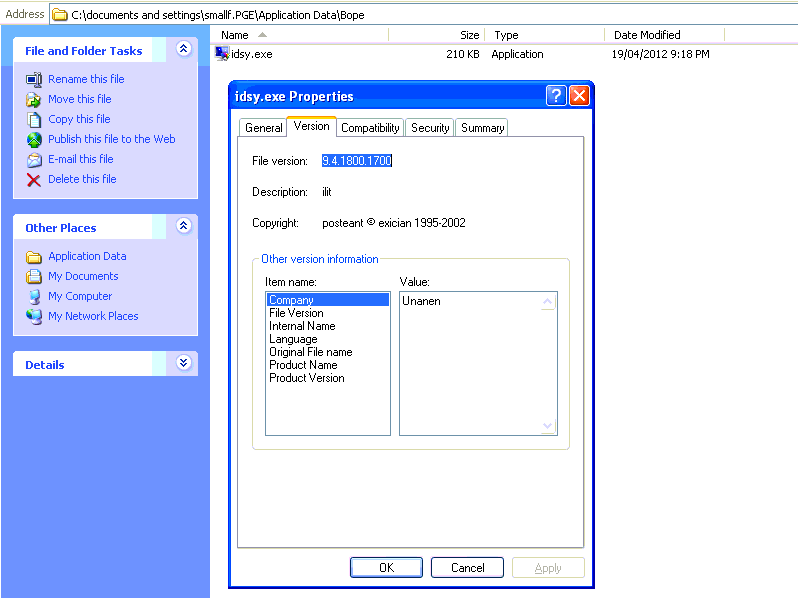
To help us diagnose similar situations more rapidly in the future, we captured a few other visible details on the file system and in the registry. Images below for your entertainment!
There was not a lot of point going any further. We understood why the problem was occurring, and how to resolve it (rebuild!). Given that no antivirus vendors appear to support removal of this trojan, we advised that the client rebuild the computer as the safest and most cost-effective way forward.
I recently was asked whether the Delphi exception event filter for WinDBG that I wrote about would also work with x64 Delphi applications. The answer was no, it wouldn’t work, but that made me curious to find out what was different with x64. I knew x64 exception handling was completely different to x86, being table based instead of stack based, but I wasn’t sure how much of this would be reflected in the event filter.
The original post contains the details about how the exception record was accessible at a known location on the stack, and how we could dig in from there.
Before firing up WinDBG, I had a look at System.pas, and found the x64 virtual method table offsets. I have highlighted the key field we want to pull out:
I also noted that the exception code for Delphi x64 was the same as x86:
cDelphiException = $0EEDFADE;
Given this, I put together a test x64 application in Delphi that would throw an exception, and loaded it into WinDBG. I enabled the event filter for unknown exceptions, and triggered an exception in the test application. This broke into WinDBG, where I was able to take a look at the raw stack:
(2ad4.2948): Unknown exception - code 0eedfade (first chance)
First chance exceptions are reported before any exception handling.
This exception may be expected and handled.
KERNELBASE!RaiseException+0x39:
000007fe`fd6ccacd 4881c4c8000000  add     rsp,0C8h
0:000> dd rbp
00000000`0012eab0  00000008 00000000 00000021 00000000
00000000`0012eac0  0059e1f0 00000000 0059e1f0 00000000
00000000`0012ead0  0eedfade 00000001 00000000 00000000
00000000`0012eae0  0059e1dd 00000000 00000007 00000000
00000000`0012eaf0  0059e1dd 00000000 0256cff0 00000000
00000000`0012eb00  00000000 00000000 00000000 00000000
00000000`0012eb10  00000000 00000000 00000000 00000000
00000000`0012eb20  00000000 00000000 0256cff8 00000000
We can see at rbp+20 is the familiar looking 0EEDFADE value. This is the start of the EXCEPTION_RECORD structure, which I’ve reproduced below from Delphi’s System.pas with a little annotation of my own:
We do have to watch out for member alignment with this structure — because it contains both 4 byte DWORDs and 8 byte pointers, there are 4 bytes of hidden padding after the NumberParameters member, as shown below (this is from MSDN, sorry to switch languages on you!):
But what we can see from TExceptionRecord is that at offset 0x28 in the record is a pointer to our ExceptObject. Great! That’s everything we need. We can now put together our x64-modified event filter.
And with this filter installed, here is how a Delphi exception is now displayed in WinDBG:
(2ad4.2948): Unknown exception - code 0eedfade (first chance)
00000000`0059e0cf  "MyException"
00000000`02573910  "My very own kind of error message"
First chance exceptions are reported before any exception handling.
This exception may be expected and handled.
KERNELBASE!RaiseException+0x39:
000007fe`fd6ccacd 4881c4c8000000  add     rsp,0C8h
I’ll dissect the pointer offsets a little more than I did in the previous blog, because they can be a bit confusing:
rbp+48 is a pointer to the exception object (usually a type that inherits from Exception).
poi(rbp+48) dereferences that, and at offset 0 right here, we have a pointer to the class type.
Before we look at the class type, poi(rbp+48)+8 is the first member of the object (don’t forget ancestor classes), which happens to be FMessage from the Exception class. That gives us our message.
Diving deeper, poi(poi(rbp+48)) is now looking at the class type.
And we know that the offset of vmtClassName is -112 (-0x70). So poi(poi(poi(rbp+48))-70) gives us the the ShortString class name, of which the first byte is the length.
So we finish with poi(poi(poi(rbp+48))-70)+1, which lets us look at the string itself.
You will see that to access the exception message, I have opted to look directly at the Exception object rather than use the more direct pointer which is on the stack. I did this to make it easier to see how it might be possible to pull out other members of descendent exception classes, such as ErrorCode from EOSError.
And one final note: looking back on that previous blog, I see that one thing I wrote was a little misleading: the string length of FMessage is indeed available at poi(poi(rbp+48)+8)-4, but the string is null-terminated, so we don’t need to use it — WinDBG understands null-terminated strings. Where this is more of a problem is with the ShortString type, which is not null-terminated. This is why sometimes exception class names displayed using this method will show a few garbage characters afterwards, because we don’t bother about accounting for that; the L16 parameter prevents us dumping memory until we reach a null byte.
A customer reported a problem with starting our application today. The error reported by our application was strange and was not one we’d encountered before:
Exception 'Exception' in module _________.exe at 004904CB
Unable to hook API functions for print preview [-1,-1,-1,0,0,0,0]
In effect the error told us that 4 out of 7 API hooks failed. I was called upon to try and diagnose the issue.
Initially I looked for a 3rd party application that could be hooking the calls in question (RegisterClassA, RegisterClassW, RegisterClassExA, RegisterClassExW). But there were no unusual applications running according to Process Explorer, and no unexpected DLLs in memory in the process. After disabling the antivirus in case that was causing the problem, and running both RootkitRevealer and Procmon with no clear outcomes, I decided I’d need to go deeper.
Time to break out windbg. I started our process and looked at the disassembly for one of the functions that failed to hook. Here’s what I saw:
That’s pretty normal, the usual mov edi,edi that most Windows API calls start with, and what we were expecting. So I continued execution until the error occurred, and took another look at that point.
Huh, that’s kinda different. Now we were jumping off into a very unexpected part of memory. A quick check of that address revealed that it was not mapped into the normal address space of any modules. I had a look at the code in question.
0:000> u 144350 L...
00144350 55              push    ebp
00144351 8bec            mov     ebp,esp
00144353 83ec30          sub     esp,30h
00144356 f605e029150004  test    byte ptr ds:[1529E0h],4   ; 001529e0
0014435d 56              push    esi
0014435e 8b7508          mov     esi,dword ptr [ebp+8]
00144361 7433            je      00144396
00144363 e8595bffff      call    00139ec1
00144368 84c0            test    al,al
0014436a 742a            je      00144396
0014436c 85f6            test    esi,esi
0014436e 7426            je      00144396
00144370 833e30          cmp     dword ptr [esi],30h
00144373 7521            jne     00144396
00144375 8b4608          mov     eax,dword ptr [esi+8]
00144378 e8fdfeffff      call    0014427a
0014437d 85c0            test    eax,eax
0014437f 7415            je      00144396
00144381 6a30            push    30h
00144383 56              push    esi
00144384 8d4dd0          lea     ecx,[ebp-30h]
00144387 51              push    ecx
00144388 e818010000      call    001444a5
0014438d 8945d8          mov     dword ptr [ebp-28h],eax
00144390 8d45d0          lea     eax,[ebp-30h]
00144393 50              push    eax
00144394 eb01            jmp     00144397
00144396 56              push    esi
00144397 ff1568141300    call    dword ptr ds:[131468h]   ; -> 02200126
0014439d 5e              pop     esi
0014439e c9              leave
0014439f c20400          ret     4
A bit hard to know what it was doing but there was a call at the bottom there that was worth a quick look.
Yep, as expected it was a jump back to the original API function, 5 bytes in. That looked like a hook library was being used because the callback to the original function was in a separate memory block. But no real info. But again, looking at the address space revealed it belonged to no known module.
0:000> !address 2200126
    02200000 : 02200000 - 00001000
                    Type     00020000 MEM_PRIVATE
                    Protect  00000040 PAGE_EXECUTE_READWRITE
                    State    00001000 MEM_COMMIT
                    Usage    RegionUsageIsVAD
At this stage, it was clear we were looking at malware, so I decided to look for some strings in the data area referenced earlier (in blue, above). Initially I found only strings pointing to Application Data and other uninteresting sources.
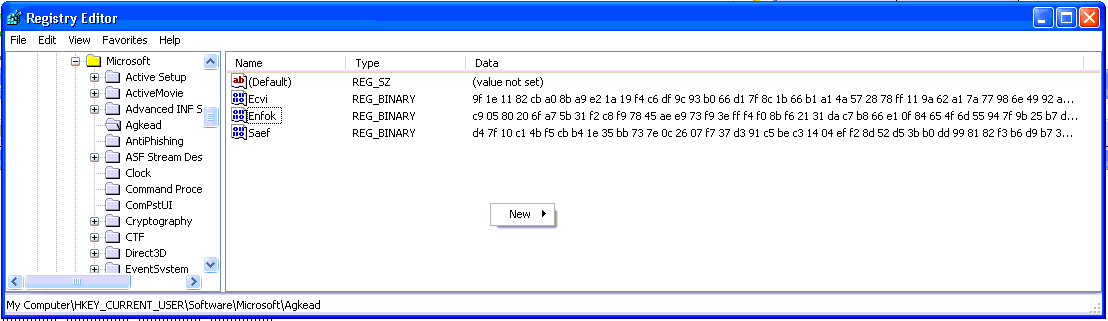
0:000> du 152f68
00152f68  "SOFTWARE\Microsoft\Agkead"
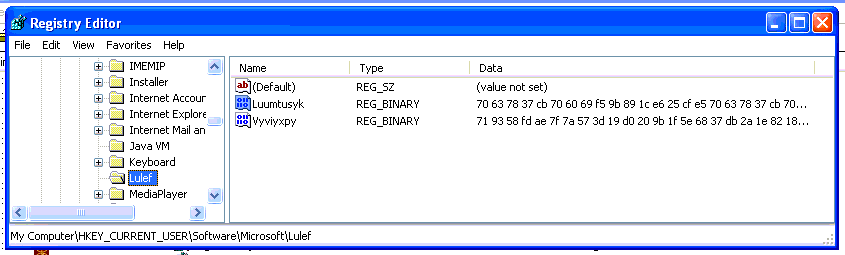
A quick glance at that registry key showed the following suspicious registry entries:
I picked up a few other interesting strings as well:
0:000> du 152fe8
00152fe8  "Global\{451EEC04-7C31-7A30-8C56-"
00153028  "BCE6C174342E}"
0:000> du 1527e0
001527e0  "Enfok"
The following string was also interesting:
0:000> du 1523d4
001523d4  "\Documents and Settings\Receptio"
00152414  "n_2.PGE\Application Data\Ewacg\o"
00152454  "xmo.hio"
While the folder existed, I was unable to see the file oxmo.hio. This, as well as the fact that I could not see any user mode activity doing the hooking of the functions in question, really suggested a rootkit which was doing some cloaking, rather than simple user-mode malware.
A reference to the string Agkead was on ThreatExpert.
But by now I was really only continuing out of interest, so I handed the machine in question back to the client, with the advice that they rebuild it — difficult to be sure that the machine is clean any other way. While it would have been fun to analyse the malware further, it’s not really my job 🙁